SPECIFICATION
SUMMARY
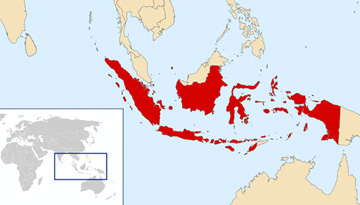
THE RUSSIAN MARKET OF THE ION EXCHANGE RESINS
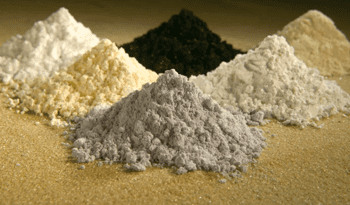
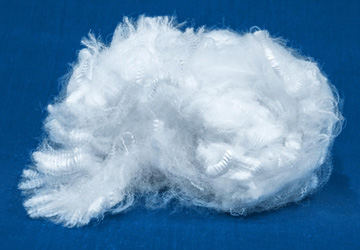
THE GENERAL PRODUCT INFORMATION
The types of ion exchange resins, the scope and fields of application
The characteristics of the ion exchange resins
THE VOLUME AND THE STRUCTURE OF THE SUPPLIES OF THE FOREIGN-MADE ANION AND CATION EXCHANGE RESINS TO THE RUSSIAN FEDERATION
The total volume and dynamics of import, 2017-2021
Dynamics of import broken down by the types of ion exchange resins (anion/cation exchange resins), 2017-2021
Dynamics of import broken down by the manufacturers, 2017-2021
THE MANUFACTURE OF THE ION EXCHANGE RESINS IN RUSSIA
The total volume and dynamics of the manufacture, 2017-2021; the main manufacturers
Dynamics and the structure of export
THE ION EXCHANGE RESINS MARKET IN RUSSIA
The total volume and dynamics of the market, 2017-2021
The structure of the market broken down by the types of resins and by the product origin
The structure of the market broken down by the consumption segments
The market shares of major players
The capacity assessment of the import substitution
THE PRICE LEVELS FOR THE ION EXCHANGE RESINS IN RUSSIA
The prices levels for the foreign-made and Russian-made cation and anion exchange resins
The structure of the prices for the foreign-made cation and anion exchange resins broken down by the main manufacturers and by the brands
The structure of the prices for the Russian-made cation and anion exchange resins broken down by the main manufacturers and by the brands
The price comparison of the Russian-made and foreign-made cation and anion exchange resins depending on the characteristics of the ion exchange resins
THE POTENTIAL SUPPLIERS OF THE TECHNOLOGIES FOR THE MANUFACTURE OF THE ION EXCHANGE RESINS
THE GLOBAL MANUFACTURERS OF THE ION EXCHANGE RESINS, THE PRESENCE ON THE MARKET OF THE RUSSIAN FEDERATION
THE POTENTIAL PARTNERS IN THE CREATION OF MANUFACTURE OF THE ION EXCHANGE RESINS
Extrepure Resin
Suzhou Bojie Resin Technology
Hebi Juxing Resin
Jiangsu Suqing Water Treatment Engineering Group
Ningbo Zhengguang Resin
Bengbu Dongli Chemical
Thermax Group
Anhui Sanxing Resin Technology
Sunresin New Materials
Jiangyin Danhao Trading
Beijing Hongvadar Engineering Technology
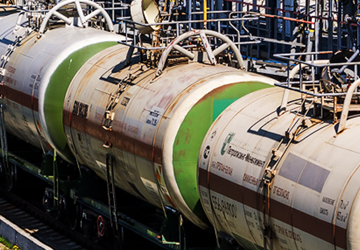
THE RAW MATERIALS FOR THE MANUFACTURE OF THE ION EXCHANGE RESINS
THE TECHNOLOGIES FOR THE MANUFACTURE OF THE ION EXCHANGE RESINS
The general information
The preparation of the polymer matrix
The insertion of functional groups
A block diagram of the process of the manufacture of the ion exchange resins
THE MAIN RAW MATERIALS FOR THE MANUFACTURE OF THE ION EXCHANGERS
THE MATRIX
The general information
The information about the manufacture
Price levels
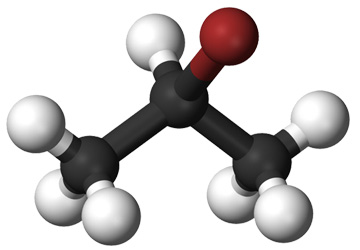
FUNCTIONAL GROUPS
The general information
The information about the manufacture
The information about the import
Price levels
Assessment of the availability of the raw materials
APPENDICES
APPENDIX 1. THE TYPES OF THE ION EXCHANGE RESINS MANUFACTURED BY “TOKEM RESEARCH AND PRODUCTION ASSOCIATION” LLC AND THEIR SCOPES
APPENDIX 2. SPECIFICATION FOR THE ION EXCHANGE RESINS OF THE RUSSIAN MANUFACTURERS
APPENDIX 3. THE SUPPLIES OF THE ION EXCHANGE RESINS FOR THE NUCLEAR INDUSTRY
APPENDIX 4. DYNAMICS AND THE STRUCTURE OF THE RUSSIAN MARKET OF THE ION EXCHANGE RESINS IN RUBLES
APPENDIX 5. THE TECHNOLOGIES FOR THE MANUFACTURE OF THE ANION EXCHANGE RESINS
LIST OF TABLES AND DIAGRAMS
Table 1. The types of the ion exchange resins and their scopes
Table 2. The main characteristics of the anion exchange resins used in industrial water treatment and in thermal power engineering
Table 3. The comparison of the anion exchange resins
Table 4. The overall dynamics of the supplies of the foreign-made ion exchange resins to the Russian market broken down by the countries, 2017-2021, tons, thousand dollars
Table 5. Dynamics and the structure of the supplies of the foreign-made ion exchange resins to the Russian market broken down by the types of the resins, 2017-2021, tons, thousand dollars
Table 6. The overall dynamics of the supplies of the foreign-made ion exchange resins to the Russian market broken down by the manufacturers, 2017-2021, tons, thousand dollars, %
Table 7. Dynamics and the structure of the Russian manufacture of the ion exchange resins broken down by the manufacturers, 2017-2021, tons
Table 8. The information about other companies claiming to manufacture the ion exchange resins
Table 9. The strong and weak points of the main Russian manufacturers of the ion exchange resins
Table 10. Dynamics and the structure of the Russian export of the ion exchange resins broken down by the countries of destination and by the manufacturers, 2017-2021, tons, thousand dollars
Table 11. Share of exports in the Russian manufacture of the ion exchange resins, 2017-2021
Table 12. Share of exports in the Russian manufacture of the ion exchange resins, 2017-2021
Table 13. Dynamics and the structure of the Russian market of the ion exchange resins, 2017-2021, tons, million dollars
Table 14. The structure of the Russian market of the ion exchange resins by the segments, 2021, tons, million rubles, million dollars
Table 15. The structure of the Russian market of the ion exchange resins by the main players, 2020, tons, million rubles
Table 16. The capacity assessment of the import substitution on the Russian market of the ion exchange resins
Table 17. The structure of the Russian market of the ion exchange resins by the types, 2021, tons
Table 18. The prices levels for the different types of the foreign-made and Russian-made cation and anion exchange resins
Table 19. The structure of the prices for the cation and anion exchange resins produced by the main foreign manufacturers broken down by the brands, 2020, dollars per kg (without VAT, at the border of the Russian Federation)
Table 20. The prices for the main foreign brands of the strong acid cation gels (the styrene-divinylbenzene matrix, the sulfone functional group, the Na+ ion form) for the water softening
Table 21. The prices for the main foreign brands of the weak acid cation macroporous resin products (the acrylic matrix, the carboxyl functional group, the H+ ion form) for the water softening
Table 22. The structure of the prices for the cation and anion exchange resins produced by the Russian manufacturers broken down by the brands and by the recipients (including VAT and shipping costs), 2021
Table 23. The structure of the prices for the Tokem’s nuclear-grade cation and anion exchange resins broken down by the brands and by the recipients (including VAT and shipping costs), 2021
Table 24. The prices for the main Russian and foreign brands of the strong acid cation gels (the styrene-divinylbenzene matrix, the sulfone functional group, the Na+ ion form) for the water softening
Table 25. The prices for the main Russian and foreign brands of the weak acid cation macroporous resin products (the acrylic matrix, the carboxyl functional group, the H+ ion form) for the water softening
Table 26. The prices for the main Russian and foreign brands of the strong basic gel anions (the styrene-divinylbenzene matrix, the type I quaternary ammonium functional group, the Cl- ion form) for the water desalination
Table 27. Prices for the main Russian and foreign brands of the weak basic anion exchange resins (the basic nitrile functional group, the OH- ion form) for the water desalination
Table 28. The leading global manufacturers of the ion exchange resins, the availability of the supplies to Russia
Table 29. The potential partners in the manufacture of the ion exchange resins
Table 30. The comparison of the Extrepure 201x4 brand and its analogues
Table 31. The comparison of the Extrepure D301 brand and its analogues
Table 32. The comparison of the Extrepure D311 brand and its analogues
Table 33. The comparison of the characteristics of the Suzhou Bojie BA400 brand and its analogues
Table 34. The comparison of the Jiangsu Suqing 201x4 brand and its analogues
Table 35. The comparison of the Jiangsu Suqing D301 brand and its analogues
Table 36. The comparison of the Jiangsu Suqing D311 brand and its analogues
Table 37. The comparison of the characteristics of the Ningbo Zhengguang Resin ZGA 304, ZGA 307 brands and their analogues
Table 38. The comparison of the characteristics of the Ningbo Zhengguang Resin ZGA 451 brand and its analogues
Table 39. The comparison of the characteristics of the Ningbo Zhengguang Resin ZGA 412 brand and its analogues
Table 40. The comparison of the characteristics of the Bengbu Dongli Chemical MA201 brand and its analogues
Table 41. The comparison of the characteristics of the Bengbu Dongli Chemical MA301 brand and its analogues
Table 42. The comparison of the characteristics of the Anhui Sanxing Resin Technology 201x4 brand and its analogues
Table 43. The comparison of the characteristics of the Anhui Sanxing Resin Technology D301 brand and its analogues
Table 44. The comparison of the characteristics of the Anhui Sanxing Resin Technology D311 brand and its analogues
Table 45. The comparison of the characteristics of the Sunresin SEPLITE SA470 brand and its analogues
Table 46. The comparison of the characteristics of the Sunresin SEPLITE SA470 brand and its analogues
Table 47. The comparison of the characteristics of the Sunresin SEPLITE LX67 brand and its analogues
Table 48. The main technologies for producing ion exchange resins
Table 49. The main raw materials for the manufacture of the ion exchange resins
Table 50. The main raw materials for the preparation of the ion exchange resins matrix
Table 51. Dynamics and the structure of the Russian manufacture of the main raw materials (the matrix) for the manufacture of the ion exchange resins broken down by the manufacturers, 2017-2020, thousand tons
Table 52. The main raw material for the production of ion exchange resins (matrix), volume of commodity production
Table 53. The main raw material for the production of ion exchange resins, level of prices, 2020-2021, dollars per kg
Table 54. Dynamics of the styrene-divinylbenzene copolymer prices, comparison with the prices for ion exchange resins, 2018-2020, dollars per kg
Table 55. Amines used in the manufacture of anion exchangers
Table 56. Dynamics and the structure of the Russian manufacture of the raw materials (functional groups) for the manufacture of anion exchangers broken down by the manufacturers, 2017-2020, thousand tons
Table 57. Dynamics and the structure of Russian export of amines, 2017-2020, thousand tons
Table 58. Production and import volumes of amines
Table 59. Prices for amines, dollars per kg, excluding VAT, at the border of the Russian Federation
Table 60. Availability of the main raw materials for the production of anion exchangers
Table 61. Risks related to raw materials and ways to reduce these risks
Table 62. Comparison of existing technologies, raw materials used and possible suppliers for the production of anion exchangers
Table 63. Types of ion exchange resins and their purpose
Table 64. Specification for ion exchange resins in Russia
Table 65. Dynamics and the structure of sales of Tokem’s nuclear-grade ion exchange resins broken down by the recipients and types of ion exchange resins, 2018-2021, tons
Table 66. The structure of procurement of nuclear-grade ion exchange resins in the Russian Federation by brands and types of ion exchange resins, 2021, tons
Table 67. Dynamics and the structure of the Russian market of ion exchange resins, 2017-2021, tons, million rubles
Table 68. Technologies for the production of anion exchange resins
Diagram 1. Dynamics and the structure of the supplies of the foreign-made ion exchange resins to the Russian market broken down by the types of the resins, 2017-2021, thousand tons, million dollars
Diagram 2. Dynamics and the structure of the Russian market of ion exchange resins broken down by the types of ion exchange resins, 2017-2021, thousand tons, million dollars
Diagram 3. The share of imports in the Russian market of ion exchange resins broken down by product types, 2021, % (tons), % (dollars)
Diagram 4. The structure of the Russian market of the ion exchange resins by the segments, 2021, thousand tons, % (tons)
Diagram 5. The dynamics of prices for the main raw materials for obtaining a matrix of ion exchange resins, 2018-2021, dollars per kg
File name: API-2102