
Aim of the study
To conduct a study of production volumes and ways of naphthalene processing, to identify market trends in Russia and abroad.
Research objectives
Evaluation of the market in the following areas:
- Global naphthalene market
- Volume and dynamics of naphthalene production in Russia
- Naphthalene market segmentation according to processing directions
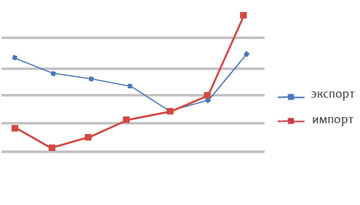
- Export and import of naphthalene from / to the Russian Federation
Geography research
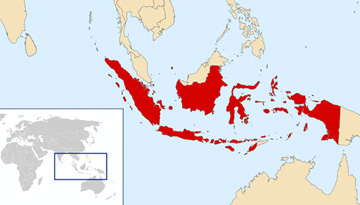
RF, global market
Methodology
• analysis of statistical data, specialized literature and website data of companies producing and consuming naphthalene;
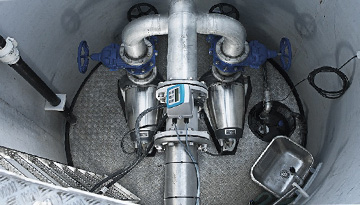
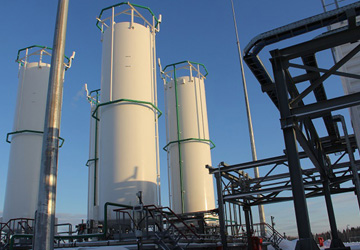
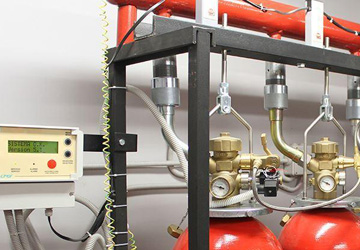
• information of companies offering solutions for the transportation and storage of naphthalene;
• analysis of foreign economic activity
When analyzing foreign trade, the TNVED code was used:
2707 40 - Distillation products of coal tar - naphthalene
In the analysis of rail transport the following codes of Ministry of Railways were used:
Old nomenclature - 71,131
Classes of transport rates, new nomenclature - 49,146
CONTENTS
INTRODUCTION
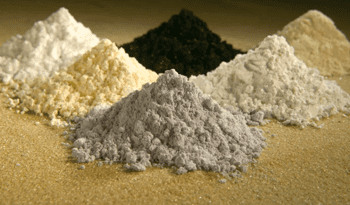
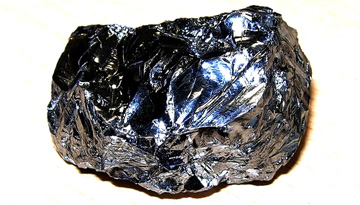
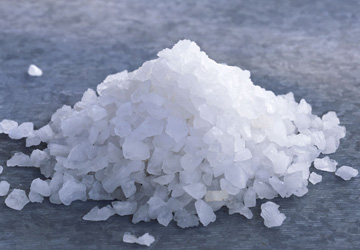
GENERAL INFORMATION ABOUT NAPHTHALENE
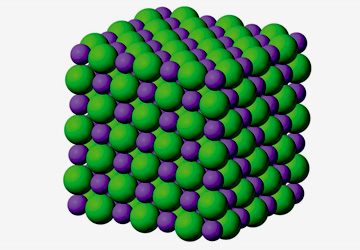
PHYSICOCHEMICAL PROPERTIES
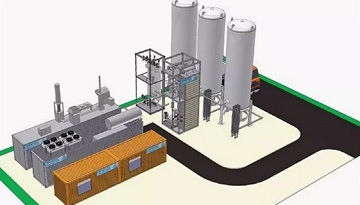
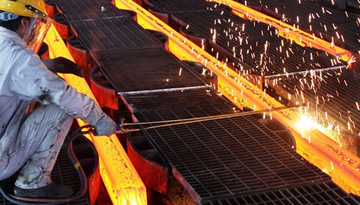
PRODUCTION TECHNOLOGIES
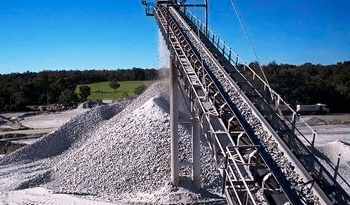
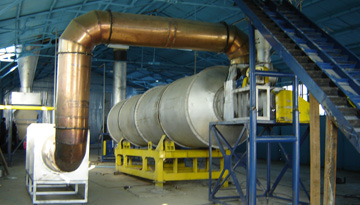
COAL TAR PROCESSING
OIL REFINING
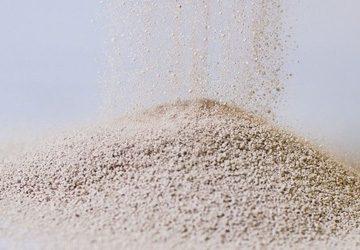
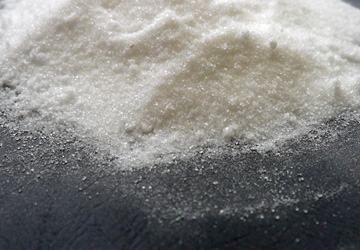
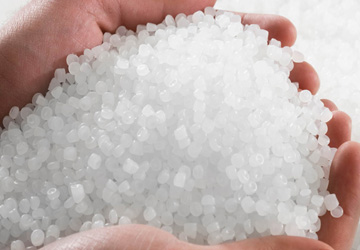
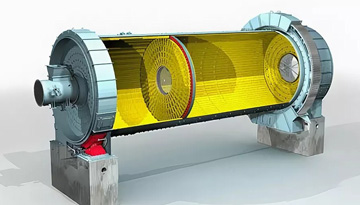
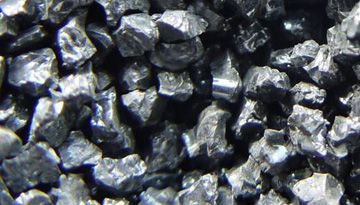
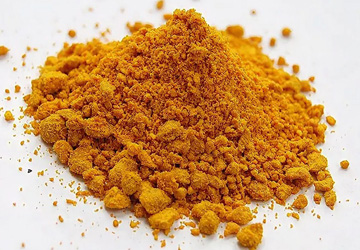
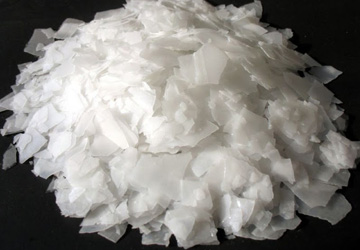
MANUFACTURE OF CRYSTALLINE NAPHTHALENE
DEVELOPMENT TRENDS OF THE GLOBAL MARKET
PRODUCTION
PRODUCTION DYNAMICS
WORLD PRODUCTION STRUCTURE BY REGION
PRODUCTION STRUCTURE BY TECHNOLOGY
CONSUMPTION
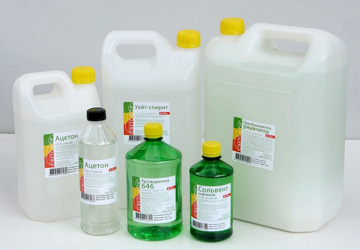
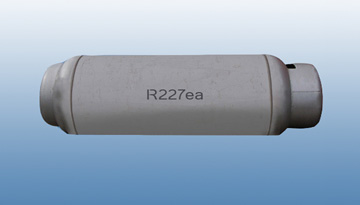
CONSUMPTION STRUCTURE BY INDUSTRY
DEVELOPMENT PROSPECTS FOR CONSUMING INDUSTRIES
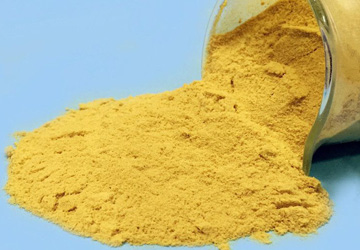
PHTHALIC ANHYDRIDE
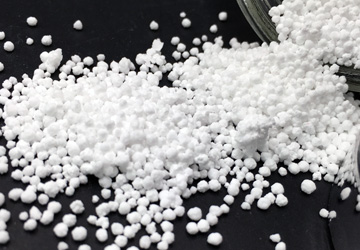
NAPHTHALENE SULFONATES
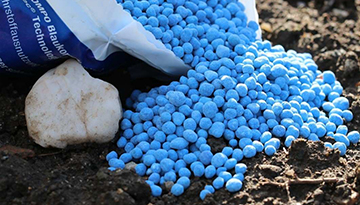
PLANT PROTECTION PRODUCTS
FORECAST OF NAPHTHALENE CONSUMPTION IN THE GLOBAL MARKET
BALANCE OF SUPPLY AND DEMAND OF NAPHTHALENE IN THE GLOBAL MARKET
EXPORT AND IMPORT SUPPLIES OF NAPHTHALENE IN THE GLOBAL MARKET
NAPHTHALENE PRICES IN THE GLOBAL MARKET
RUSSIAN MARKET
PRODUCTION
PRODUCTION DYNAMICS
DISTRIBUTION OF NAPHTHALENE PRODUCTION BY COMPANY AND REGION
INTERNATIONAL TRADE
DYNAMICS AND GEOGRAPHICAL STRUCTURE OF RUSSIAN NAPHTHALENE EXPORTS
IMPORT DYNAMICS AND STRUCTURE
MAJOR RUSSIAN CONSUMERS OF FOREIGN-MADE NAPHTHALENE
CONSUMPTION
CONSUMPTION STRUCTURE BY REGION
CONSUMPTION STRUCTURE BY INDUSTRY
CONSUMPTION DYNAMICS AND FORECAST
THE LARGEST CONSUMERS OF NAPHTHALENE IN THE RUSSIAN MARKET (VOLUMES, DYNAMICS OF PURCHASES)
RUSSIAN NAPHTHALENE MARKET PRICES
LIST OF DIAGRAMS
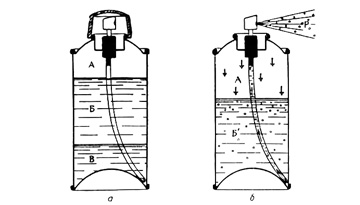
Figure 1. Scheme of rectification of coal tar in a tubular unit with a single column
Figure 2. Dynamics of global production of naphthalene, 2000-11, thousand tons
Figure 3. Dynamics of naphthalene production by region and country, 2000-11, thousand tons
Figure 4. Changes in the ratio of naphthalene production in China and developed countries of the world, 2000–11, kt,%
Figure 5. Structure of naphthalene consumption in the world by industry, thousand tons,%
Figure 6. Structure of naphthalene consumption in main regions and countries by industry, thousand tons,%
Figure 7. The structure of global consumption of phthalic anhydride by region and country,%
Figure 8. The structure of global consumption of phthalic anhydride by industry,%
Figure 9. Structure of global consumption of construction additives by region and country, billion USD
Figure 10. Dynamics of consumption of naphthalene in the world, forecast up to 2015 thousand tons,%
Figure 11. Dynamics of consumption of naphthalene by region and country, 2000-11, thousand tons
Figure 12. Changes in the balance of supply and demand of naphthalene in the world, 2000-11, thousand tons
Figure 13. Changes in the balance of supply and demand of naphthalene in the leading regions and countries of the world, 2000-11, thousand tons
Figure 14. Leading net exporters and net importers of naphthalene, kt
Figure 15. Dynamics of naphthalene exports by supplying countries., kt
Figure 16. Structure of naphthalene import by countries, thousand tons,%
Figure 17. Dynamics of average export and import prices on naphthalene, years, USD / ton
Figure 18. Dynamics of coal prices in some countries producing naphthalene, 2005–08, USD / ton
Figure 19. Dynamics of import prices on naphthalene in China and some European countries, USD / ton
Figure 20. Dynamics of export prices for naphthalene of the leading exporting countries, USD / ton
Figure 21. The share of Russian naphthalene production in the global market, thousand tons,%
Figure 22. Dynamics of coke and naphthalene production in the Russian Federation, 2005-11, thousand tons
Figure 23. Structure of the Russian production of naphthalene by leading companies, 2011, thousand tons,%
Figure 24. Changes in the production of naphthalene by enterprises, 2008-11,%
Figure 25. Dynamics of naphthalene production in the Russian Federation by production companies, 2008-11, thousand tons
Figure 26. Structure of the Russian production of naphthalene by federal districts, 2011, thousand tons,%
Figure 27. Dynamics of naphthalene supplies to the domestic market of the Russian Federation by manufacturing companies, 2008-11, thousand tons
Figure 28. Structure of naphthalene supplies to the Russian market by manufacturing companies, 2011, kt,%
Figure 40. Dynamics of naphthalene exports from the Russian Federation, 2005-11, thousand tons
Figure 41. Dynamics of naphthalene exports from Russia by importing countries, 2008-11, thousand tons
Figure 42. Structure of naphthalene exports from Russia by importing countries, 2011, thousand tons,%
Figure 43. Dynamics of export of naphthalene from the Russian Federation by exporting companies, 2008-11, thousand tons
Figure 44. Imports dynamics of naphthalene of the Russian Federation, 2008-11, thousand tons
Figure 45. Dynamics of Russian naphthalene imports by exporting countries, 2008-11, thousand tons
Figure 29. The structure of global consumption of naphthalene by leading regions and countries, 2011, thousand tons,%
Figure 30. Structure of naphthalene consumption in the Russian Federation by industry, 2008-11, thousand tons,%
Figure 31. Dynamics of phthalic anhydride production at ZSMK, thousand tons,
Figure 32. Changes in the structure of naphthalene consumption in the Russian Federation, 2008-11, thousand tons
Figure 33. Dynamics of naphthalene consumption in the Russian Federation, 2005-11, the forecast up to 2015, thousand tons
Figure 34. Dynamics of production and consumption of naphthalene in the Russian Federation, change in the share of processing in the domestic market, 2005-10, thousand tons,%
Figure 35. Dynamics of concrete production and consumption of naphthalene in the Russian Federation, 2008-11, forecast up to 2015
Figure 36. Structure of naphthalene consumption in Russia by company, 2011, thousand tons,%
Figure 37. Changes in the structure of naphthalene consumption in the Russian Federation by company, 2008-11, thousand tons
Figure 38. Polyplast company structure
Figure 39. Dynamics of cement consumption in the Russian Federation and total sales of Polyplast, million tons, billion RUR.
Figure 46. Dynamics of export prices of the Russian Federation for naphthalene in the context of exporting companies, 2008-11, USD / ton
Figure 47. Dynamics of import prices on naphthalene of the Russian Federation by countries-importers and domestic market prices, 2008-11, USD / ton
LIST OF TABLES
Table 1. The average yield of fractions during the rectification of coal tar
Table 2. Composition of naphthalene fractions of some plants in the CIS
Table 3. The largest manufacturers of naphthalene
Table 4. Properties and scopes of naphtholinsulfonates of Nease corp
Table 6. Consumers of imported naphthalene in the Russian Federation, 2008-11
Table 5. Consumption of naphthalene in domestic production in the Russian Federation by applications and companies, 2008-11, tons