AIM OF THE RESEARCH
To provide the necessary information materials for making management decisions on the organization of the Russian production of copper sulphate
TASKS
1. The largest and medium suppliers of copper sulphate in the domestic Russian market
- Company name,
- company location
- the annual volume of shipments of copper sulfate, tons.
2. Dynamics of shipments by the largest suppliers of copper sulfate in recent years (by months), tons
3. Structure of shipments of the largest copper sulfate suppliers in the context of companies-recipients, tons.
4. The largest and average buyers of copper sulfate on the domestic Russian market (based on railway traffic)
- Company name,
- company location (region)
- annual volume of copper sulfate purchases, tons.
5. Purchases dynamics of the largest and average consumers of copper sulphate for 2008-3 months 2012 (based on rail traffic), tons
6. Purchases structure of the largest consumers of copper sulfate in the context of supplying companies, tons (based on rail traffic)
7. Importance of export deliveries of copper sulfate for the Russian market (export 2008-3 months 2012, tons)
8. Major Russian exporting companies among Russian producers of copper sulfate.
9. Major foreign companies-buyers of Russian-made copper sulfate
- Company name
- company location
- purchases volume of copper sulphate of Russian production, (year, tons / USD)
10. Dynamics of prices for exported copper sulphate of Russian production, for 2008-3 months 2012, USD / tons
11. Importance of copper sulfate imports for the Russian market (imports 2008-3 months 2012, tons)
12. Major foreign companies producing copper sulfate, represented on the Russian market
13. Major Russian companies-buyers of copper sulfate of foreign production
- Company name
- Company location
- purchases volume of copper sulfate of foreign production, (year, tons / USD).
14. Dynamics of prices for imported copper sulfate of foreign production, for 2008- 3 months 2012, USD / tons
15. Development trends of the Russian market of copper sulfate
16. Analysis of international trade 2008-2010, 2011 - in the presence of the UN
CONTENTS
GENERAL INFORMATION
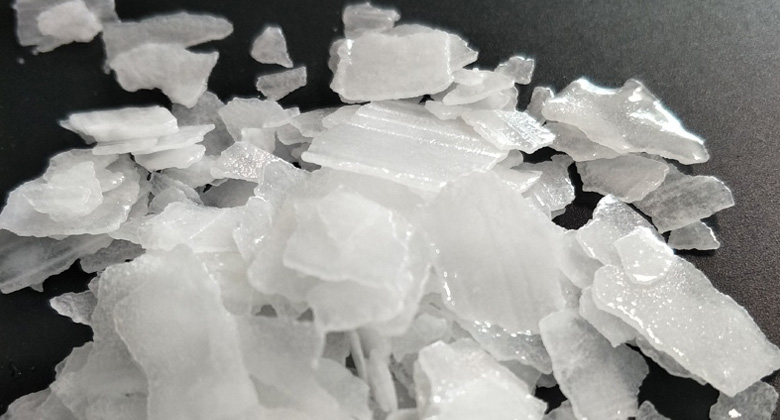
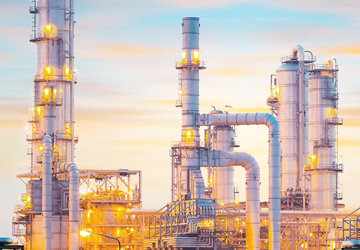
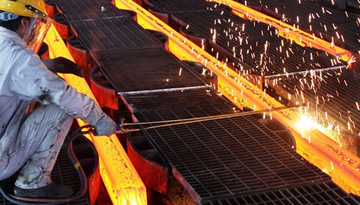
PRODUCTION OF COPPER SULFATE
Production dynamics of copper sulfate in Russia
The main Russian producers of copper sulfate
- Uralelectromed
- Intermix Met
- NEKK
- Kyshtym Copper Electrolytic Plant
- South Urals Nickel Plant
ANALYSIS OF FOREIGN TRADE OPERATIONS
World trade with copper sulphate
Import of copper sulphate to Russia
- Dynamics and regional imports structure of copper sulfate
- The main recipients of copper sulfate of foreign production
Russian export of copper sulfate
- Dynamics and regional export structure of copper sulfate
- The main recipients of Russian copper sulfate
CONSUMPTION OF COPPER SULFATE IN RUSSIA
Dynamics and structure of the railway deliveries of copper sulfate
- Regional structure of the railway deliveries of copper sulfate
- supply structure of copper sulfate in a cut by senders
Major Russian copper sulfate recipients
BASIC PARAMETERS OF THE COPPER SULFATE MARKET
PRICING ENVIRONMENT FOR COPPER SULFATE
Export prices for copper sulfate
Import prices for copper sulfate
TRENDS IN THE MARKET OF COPPER SULFATE
THE VIABILITY OF ORGANIZATION OF COPPER SULFATE PRODUCTION ON THE RUSSIAN MARKET
APPENDICES
APPENDIX. MONTHLY DYNAMICS OF EXPORT VOLUMES AND PRICES FOR COPPER SULFATE OF RUSSIAN PRODUCTION, 2008-2012 (1st QUARTER)
LIST OF ILLUSTRATIONS
Table 1. Brief technical characteristics of copper sulphate by brand
Table 2. Volume of production of copper sulphate by Russian enterprises, 2008-5 months 2012, thousand tons
Table 3. Summary information on the activities of producers of copper sulphate
Table 4. Dynamics of world trade with copper sulfate, 2008-2011
Table 5. Structure of world trade with copper sulfate in the section by major exporting countries, thousand tons, 2008-2011
Table 6. The structure of world trade with copper sulfate in the section by major importing countries, thousand tons, 2008-2011
Table 7. Structure of visible supplies of copper sulfate from the Netherlands by main importing countries, tons, 2008-2011
Table 8. Import volume of copper sulfate, 2008-2011, thousand tons,%
Table 9. Supply volume of copper sulfate by country - importers, 2008-2011, tons,%
Table 10. Supply volume of copper sulfate in the context of producers, 2008-2011, tons,%
Table 11. Supply volume of copper sulfate by recipient, 2008-2011, tons,%
Table 12. Supply volume of copper sulfate from China in the context of recipients, 2008-2011, tons,%
Table 13. Export volume of copper sulfate, 2008-2011, thousand tons,%
Table 14. Export structure of copper sulfate in the section by countries of destination, 2008-1 quarter 2012, thousand tons,%
Table 15. Export volume of copper sulphate by producer, 2008-2011, thousand tons,%
Table 16. Export volume of copper sulfate in the section by countries of destination and producers, 2008-2011, thousand tons,%
Table 17. Export volume of copper sulfate in the section by countries of destination and recipients, 2008-2011, thousand tons,%
Table 18. The volume of exports of copper sulfate by producer and recipient, 2008-2011, thousand tons,%
Table 19. The shipment volume of copper sulfate in a breakdown by quarters 2008- 1 half of 2012, thousand tons,%
Table 20. The shipment volume of copper sulfate in a breakdown by months, 2008- 1 half of 2012, thousand tons,%
Table 21. The volume of rail transportation of copper sulfate, 2008-1st half 2012, thousand tons,%
Table 22. The volume of rail transportation of copper sulfate in the section by main destination areas, 2008-1 half of 2012, thousand tons
Table 23. The volume of rail transportation of copper sulfate in the section by shippers, 2008-1st half of 2012, thousand tons
Table 24. The volume of railway transportation of copper sulfate in the section by main recipients, 2008-1st half 2012, thousand tons
Table 25. Dynamics of rail transportation of copper sulfate in the section by producers and main recipients, 2008- 1st half 2012, thousand tons
Table 26. The main parameters of the Russian market of copper sulfate
Table 27. The average price of exported technical copper sulfate according to GOST 19347-99, 2008-1 quarter 2012, USD / kg, RUB / kg
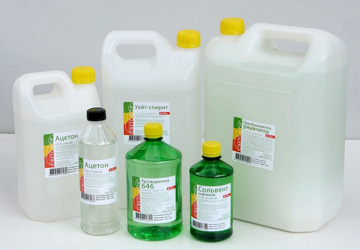
Table 28. The cost of some types of imported products
Diagram 1. Dynamics of copper sulfate production in the Russian Federation, 2008-5 months 2012 , thousand tons,%
Diagram 2. Dynamics of copper sulfate production by Russian enterprises, 2008-5 months 2012, thousand tons
Diagram 3. Share distribution of the main countries-exporters of copper sulphate, thousand tons, 2008-2011
Diagram 4. Structure of world trade with copper sulfate in the section by main importing countries, thousand tons, 2008-2011
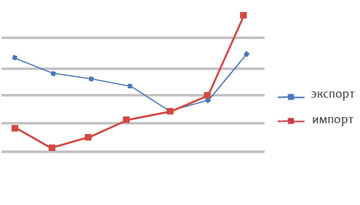
Diagram 5. Import dynamics of copper sulfate, 2008-2011, thousand tons,%
Diagram 6. Export dynamics of copper sulfate, 2008-2011, thousand tons,%
Diagram 7. Export dynamics of copper sulfate by country, 2008–1 quarter 2012, thousand tons,%
Diagram 8. Export dynamics of copper sulfate by producer, 2008-2011, thousand tons,%
Diagram 9. Export dynamics of copper sulfate by recipient, 2008-2011, thousand tons,%
Diagram 10. Dynamics of copper sulfate shipments in a section by quarters 2008-1 half of 2012, thousand tons
Diagram 11. Dynamics of copper sulfate shipments by month, 2008–1st half of 2012, thousand tons,%
Diagram 12. Dynamics of railway transportation of copper sulfate, 2008-1st half 2012, thousand tons,%
Diagram 13. Dynamics of rail transportation of copper sulfate in the section by main destination areas, 2008-1st half 2012, thousand tons
Diagram 14. Dynamics of rail transportation of copper sulfate by sender, 2008-1st half of 2012, thousand tons
Diagram 15. The dependence between copper cost on LME and the average export price of copper sulfate, 2008-2011.
File Name: API1479
Order a similar study