
Technical enquiry
Summary
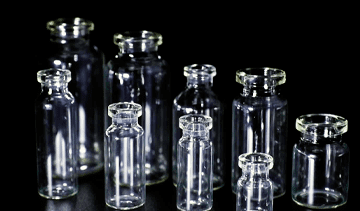
Analysis of the Russian production of glass medical containers
Total volume and dynamics of Russian production in 2018-2020
Structure of Russian production by enterprise, operating rate
Plans to create the production of medical glass by Russian manufacturers
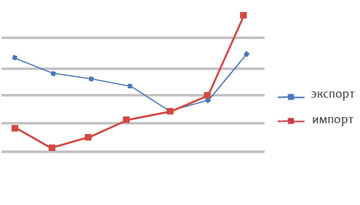
Analysis of Russian export of glass medical containers
Total volume and dynamics of export in 2018-2020
Export structure by manufacturer and type of medical containers
Export structure by destination countries
Analysis of Russian import of glass medical containers
Total volume and dynamics of import in 2018-2020, import structure by type of medical containers
Import structure by countries of origin and manufacturers
Import structure by recipient
Level of import prices for medical containers from glass
Analysis of the Russian market of glass medical containers
Total volume and dynamics of the Russian market in 2018-2020
Distribution of market shares between key players
Most required medical container sizes
LIST OF TABLES AND DIAGRAMS
Table 1. Dynamics and structure of Russian production of glass medical products in a section by product type, 2018-2020, tons, million Rur, million pieces
Table 2. Dynamics and structure of Russian production of glass medical products in a section by manufacturer and type of product, 2018-2020, tons, million Rur, million pieces
Table 3. Capacities and operating rate of Russian producers of glass medical products
Table 4. Plans for expansion and creation of new capacities for production of glass medical products
Table 5. Dynamics and structure of Russian export of glass medical products by product type, 2018-2020, tons, thousand USD, million pieces
Table 6. Dynamics and structure of Russian export of glass medical products in a section by manufacturer and type of product, 2018-2020, tons, thousand USD, million pieces
Table 7. Dynamics and structure of Russian export of glass medical products in a section by countries of destination, 2018-2020, tons, thousand USD
Table 8. Dynamics and structure of Russian export of glass medical products by product types and countries of destination, 2018-2020, tons, thousand USD, million pieces
Table 9. Dynamics and structure of Russian import of glass medical products by product type, 2018-2020, tons, thousand USD, million pieces
Table 10. Dynamics and structure of Russian import of glass medical products by countries of origin, 2018-2020, tons, thousand USD
Table 11. Dynamics and structure of Russian import of glass medical products in a section by manufacturer, 2018-2020, tons, thousand USD
Table 12. Dynamics and structure of Russian import of glass medical products by product types and manufacturers, 2018-2020, tons, thousand USD, million pieces
Table 13. Dynamics and structure of Russian import of glass medical products in a section by recipient, 2018-2020, tons, thousand USD
Table 14. Structure of Russian import of glass medical products in a section by recipients, types of products and main suppliers, 2020, tons, thousand USD
Table 15. Structure of Russian import of raw materials for the production of glass medical products in a section by recipients and main suppliers, 2018-2020, tons, thousand USD
Table 16. Structure of weighted average import prices for glass medical products in a section by manufacturer and type of product, 2018-2020, USD / ton
Table 17. Structure of weighted average import prices for laboratory glassware in a section by manufacturer, 2018-2020, USD / ton
Table 18. Structure of weighted average import prices for glass tubes for production of medical products by manufacturers, 2018-2020, USD / ton
Table 19. Dynamics and structure of the Russian market of glass medical products by product types, 2018-2020, tons, million Rur, million pieces
Table 20. Structure of the Russian market of glass medical products in a section by key players, 2020, tons, million Rur, million pieces
Table 21. Main typical sizes on the Russian glass medicine market
Diagram 1. Dynamics of the Russian production of glass medical products in a section by product type, 2018-2020, thousand tons, million Rur
Diagram 2. Share distribution of Russian production of glass medical products in a section by product type, 2020,% (tons),% (Rur),% (pieces)
Diagram 3. Share distribution of Russian production of glass medical products in a section by manufacturer, 2020,% (tons),% (Rur),% (pieces)
Diagram 4. Share distribution of Russian export of glass medical products in a section by product type, 2020,% (tons),% (USD),% (pieces)
Diagram 5. Share distribution of Russian export of glass medical products in a section by countries of destination, 2020,% (tons),% (USD)
Diagram 6. Dynamics of Russian import of glass medical products in a section by product type, 2018-2020, thousand tons, million USD
Diagram 7. Share distribution of Russian import of glass medical products by product type, 2020,% (tons),% (USD)
Diagram 8. Share distribution of Russian import of glass medical products by countries of origin, 2020,% (tons),% (USD)
Diagram 9. Dynamics of the Russian market of glass medical products in a section by product type, 2018-2020, thousand tons, million Rur
Diagram 10. Share distribution of the Russian market of glass medical products by product types, 2020,% (tons),% (Rur)
Diagram 11. Import share in the Russian market of glass medical products by product types, 2020,% (tons),% (Rur)
Diagram 12. Export share from Russian production volume of glass medical products in a section by product type, 2020,% (tons),% (Rur)
File name: API-2084