SPECIFICATION
SUMMARY
SECTION 1. MARKET OF THE MMA
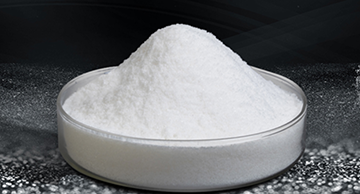
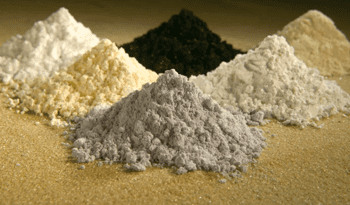
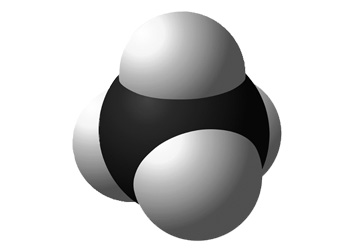
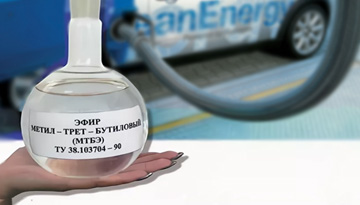
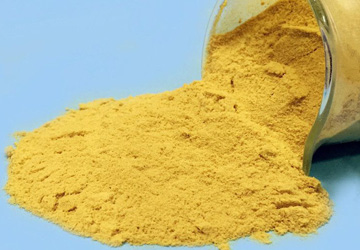
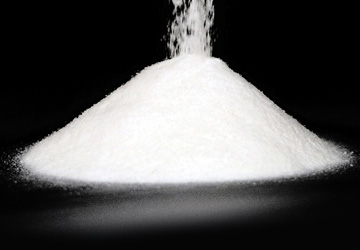
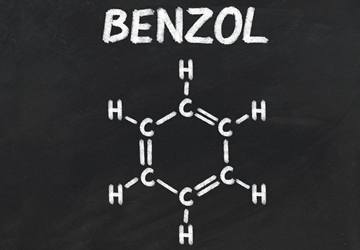
GENERAL MMA INFORMATION
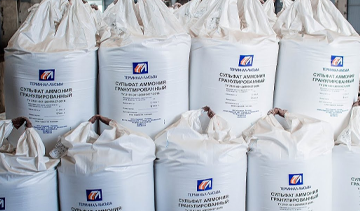
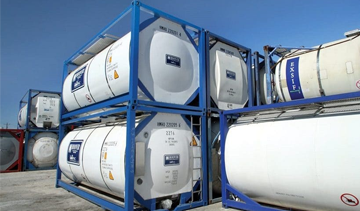
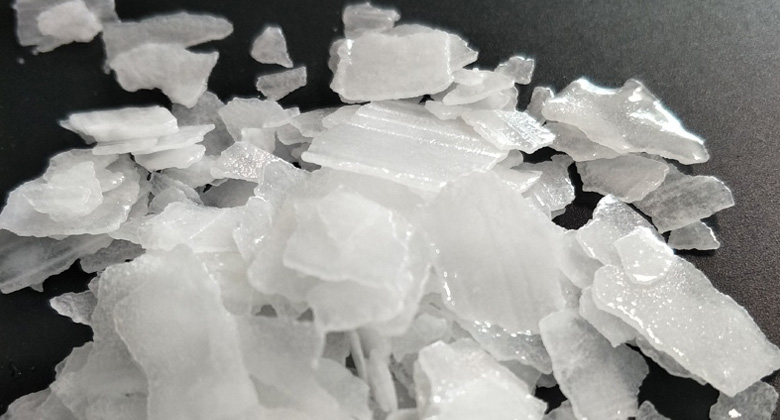
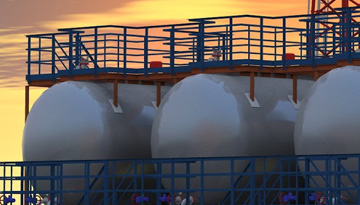
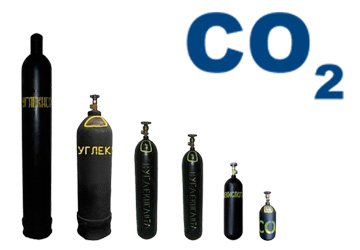
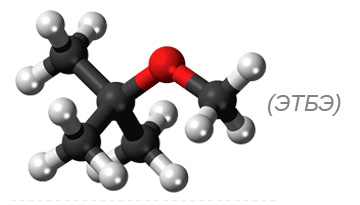
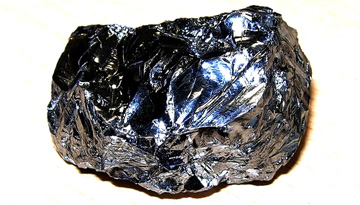
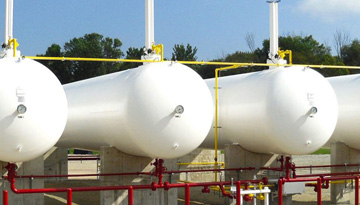
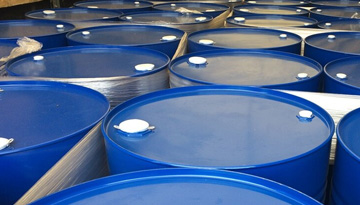
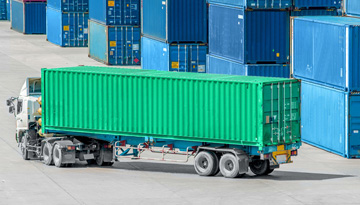
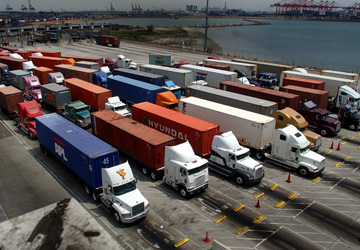
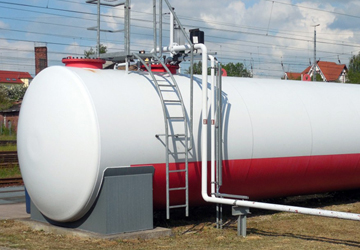
CHARACTERISTICS, LOGISTICS FEATURES
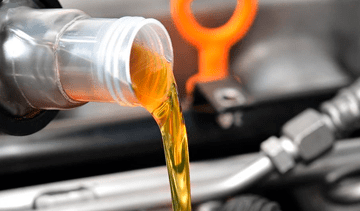
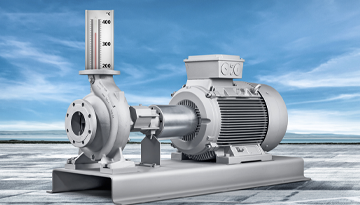
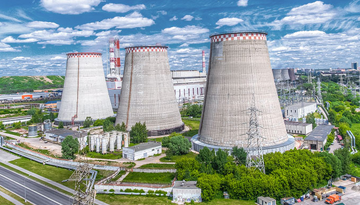
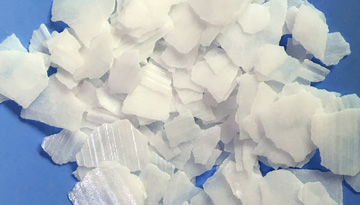
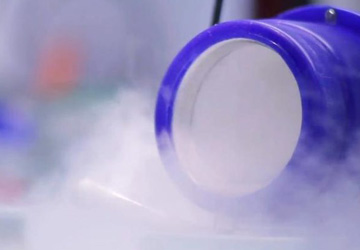
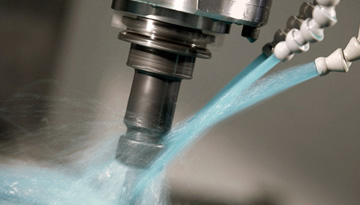
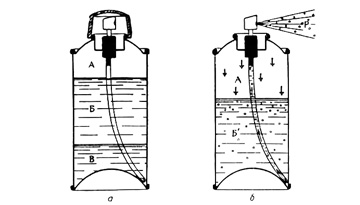
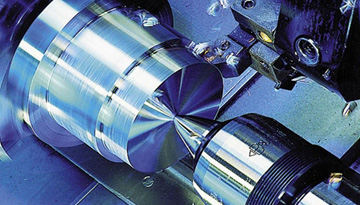
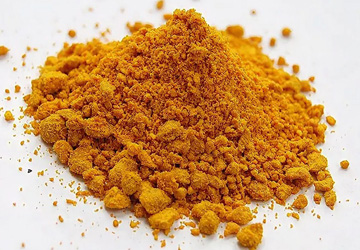
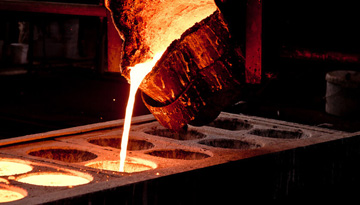
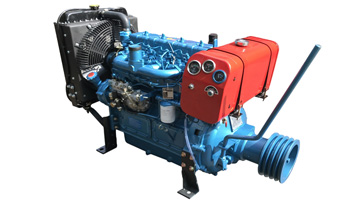
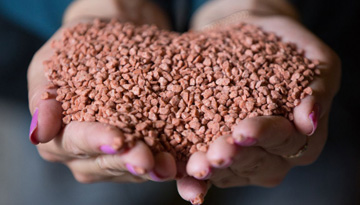
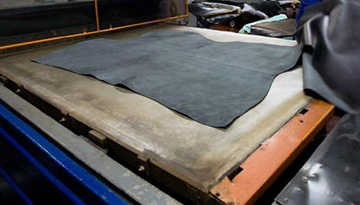
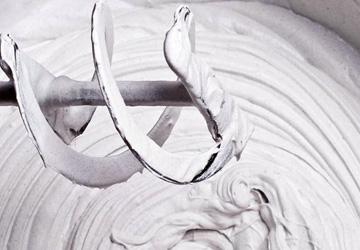
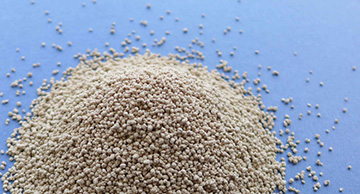
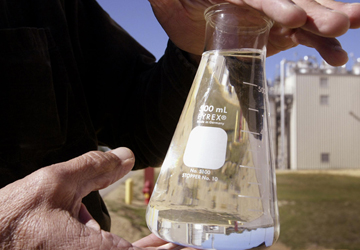
PROPERTIES, PRODUCTION METHODS AND PRODUCTION FEATURES
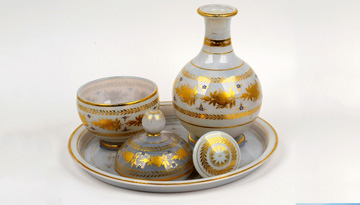
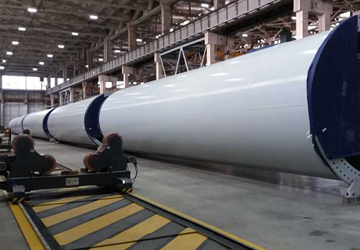
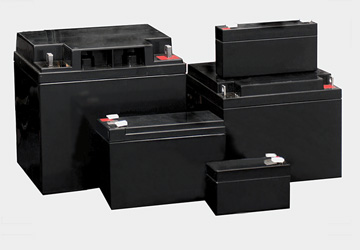
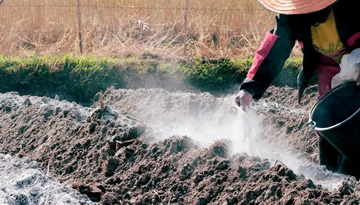
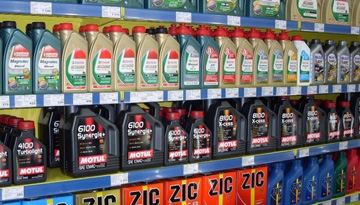
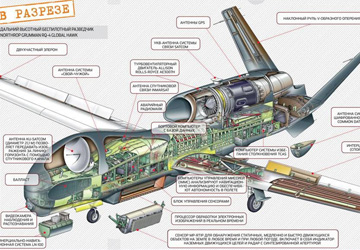
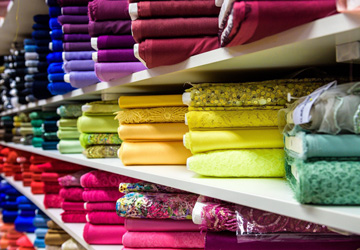
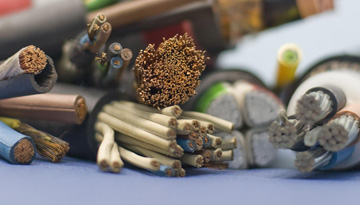
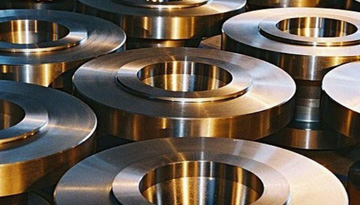
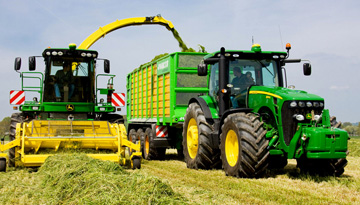
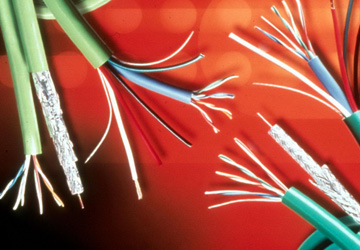
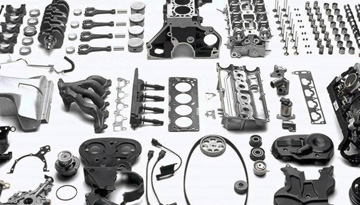
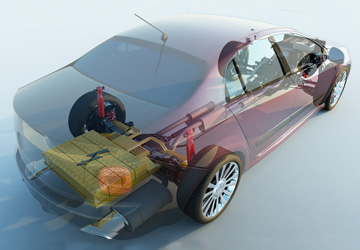
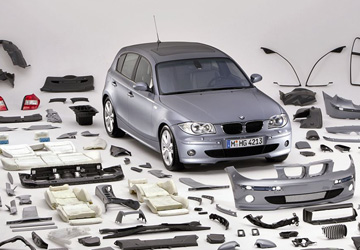
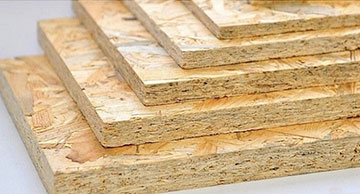
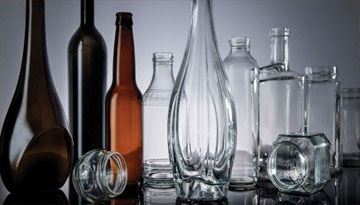
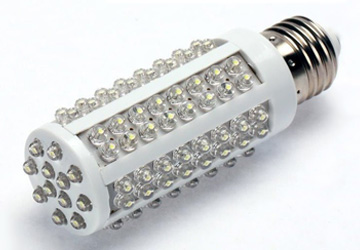
THE MAIN AREAS OF APPLICATION OF THE MMA
THE RUSSIAN MARKET OF THE MMA
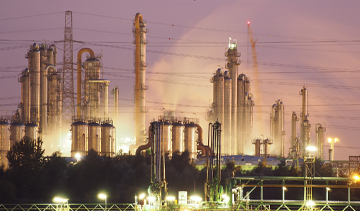
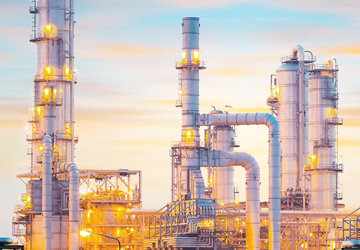
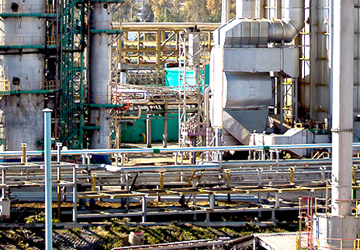
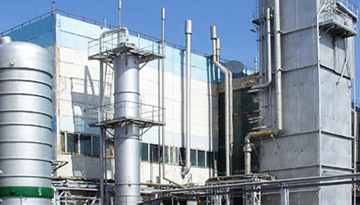
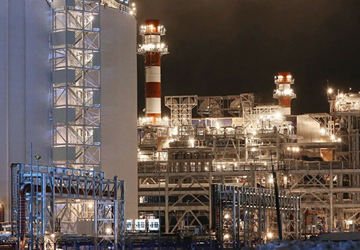
THE RUSSIAN MANUFACTURE OF THE MMA
Dynamics of the manufacture of the MMA in the years 2015-2020
The MMA production development plans
The export of the MMA
THE IMPORT OF THE MMA AND OF THE PRODUCTS BASED ON IT
The import of the MMA
Dynamics of the MMA import in the years 2015-2020
The structure of the MMA import by the product type and by the brands
The structure of the MMA import by the manufacturers and by the recipients
The import of the products based on the MMA
Dynamics and the structure of the import of the acrylic polymers in the years 2015-2020
Dynamics and the structure of the import of the acrylic paints in the years 2015-2020
THE RUSSIAN MARKET OF THE MMA
General dynamics of the MMA market in the years 2015-2020
The identified MMA consumers
The MMA prices by brands and by product type
The consumption structure by industries
Forecasts for the Russian market of the MMA
Forecast for the development of the MMA consumption segments
Forecast for the MMA prices
Forecast for the MMA market volume until 2031
THE MMA MARKET IN OTHER COUNTRIES
DYNAMICS OF THE GLOBAL MMA IMPORT IN THE YEARS 2015-2020
THE STRUCTURE OF THE GLOBAL MMA IMPORT BY IMPORTING COUNTRIES
THE STRUCTURE OF THE MMA IMPORT IN THE EUROPEAN COUNTRIES AND IN THE CIS COUNTRIES
The main MMA importing countries in Europe and in the CIS
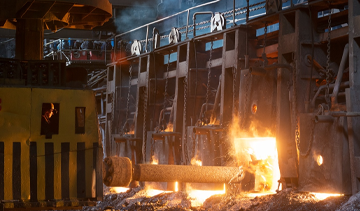
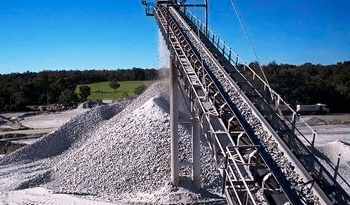
THE STRUCTURE OF THE MANUFACTURE OF THE MMA, THE MAIN MANUFACTURERS
The European countries
The CIS countries
INVESTMENT PROJECTS TO CREATE THE MMA PRODUCTION FACILITIES
The European countries
THE CIS countries and Russia
SECTION 2. MARKET OF THE PMMA
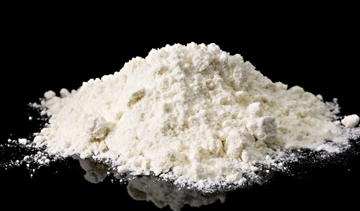
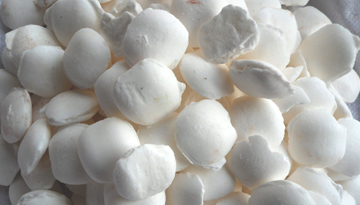
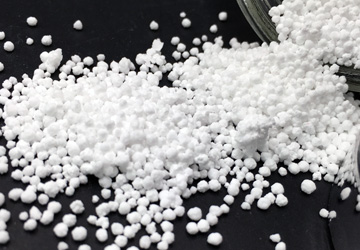
GENERAL PMMA INFORMATION
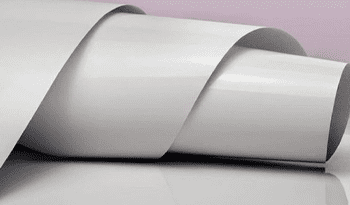
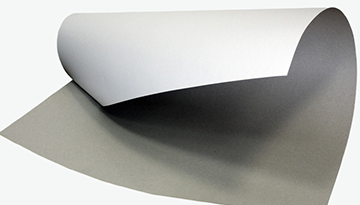
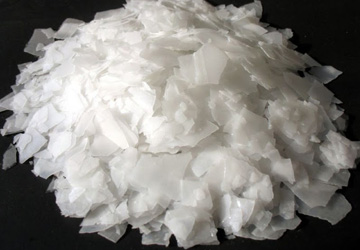
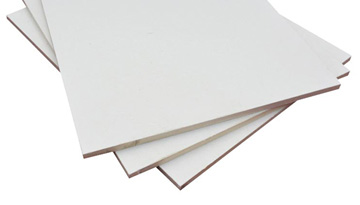
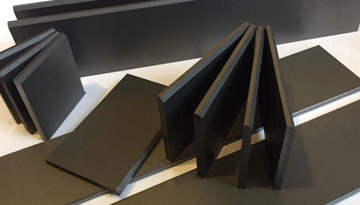
CHARACTERISTICS, LOGISTICS FEATURES
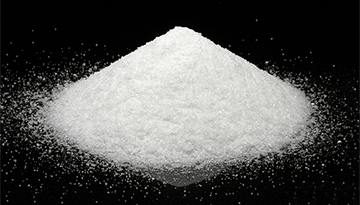
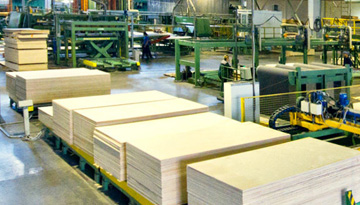
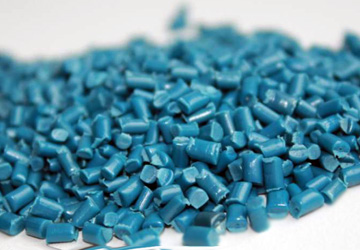
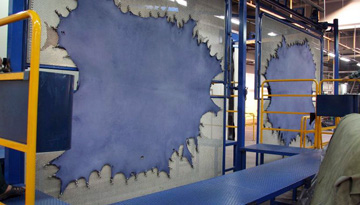
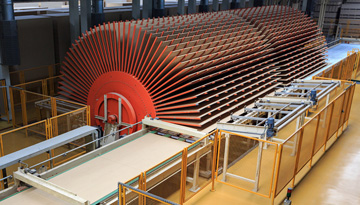
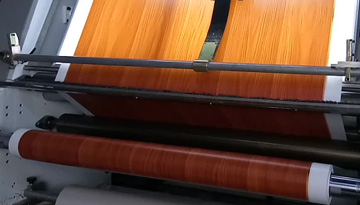
PROPERTIES, PRODUCTION METHODS AND PRODUCTION FEATURES
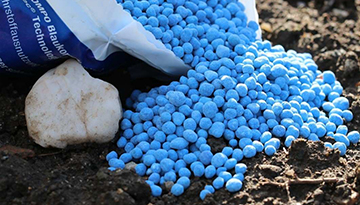
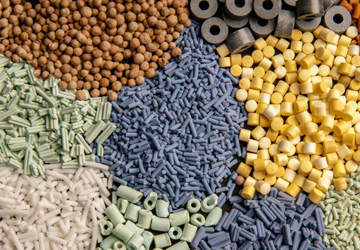
THE EXISTING BRANDS, TYPES, THE MAIN AREAS OF APPLICATION
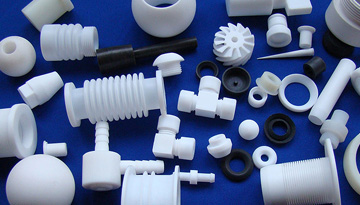
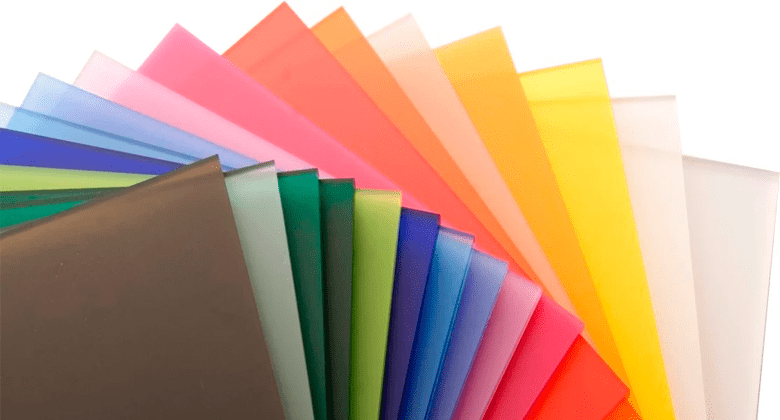
THE MAIN AREAS OF APPLICATION OF THE PMMA
THE RUSSIAN MARKET OF THE PMMA
THE RUSSIAN MANUFACTURE OF THE PMMA
Dynamics of the manufacture of the PMMA in the years 2015-2020
The export
THE IMPORT OF THE PMMA
The import of the PMMA and of the products based on it
Dynamics of the PMMA import in the years 2015-2020
The structure of the PMMA import by the manufacturers and by the forms
The structure of the PMMA import by the recipients
The foreign-made PMMA prices
The PMMA pellets prices
The PMMA sheets prices
THE RUSSIAN MARKET OF THE PMMA
General dynamics of the market in the years 2015-2020
The identified PMMA consumers
The PMMA prices by brands and by product type
The consumption structure by industries
Forecasts for the Russian market of the PMMA
Forecasts for the PMMA prices
Forecast for the PMMA market volume until 2031
THE PMMA MARKET IN OTHER COUNTRIES
DYNAMICS OF THE GLOBAL PMMA IMPORT IN THE YEARS 2015-2020
THE STRUCTURE OF THE GLOBAL PMMA IMPORT BY IMPORTING COUNTRIES
THE STRUCTURE OF THE PMMA IMPORT IN THE EUROPEAN AND IN THE CIS COUNTRIES
THE STRUCTURE OF THE MANUFACTURE OF THE PMMA, THE MAIN MANUFACTURERS
The European countries
The CIS countries
INVESTMENT PROJECTS TO CREATE THE PMMA PRODUCTION FACILITIES
The European countries
The CIS countries and Russia
CONCLUSIONS AND RECOMMENDATIONS
THE POTENTIAL COMMON MARKET ASSESSMENT FOR THE CLIENT, SALE MARKETS (RUSSIA, THE CIS, THE EUROPEAN COUNTRIES)
RECOMMENDATIONS FOR BRANDS, THE TYPE AND THE QUALITY OF THE PRODUCT
THE POTENTIAL LICENSORS OF TECHNOLOGIES, DECLARED INFORMATION ABOUT THE PURCHASE OF TECHNOLOGIES
LIST OF TABLES AND DIAGRAMS
Table 1. Matching of MMA production methods and the key raw material, the availability of the Client’s raw material
Table 2. Raw material cost comparison for the main MMA production processes, dollars per 1 ton of the MMA
Table 3. Dynamics of the manufacture of the MMA in Russia, dynamics of the revenue of the group of companies “Korund”, 2015-2020, tons, million rubles
Table 4. The structure of the Russian MMA export broken down by the recipient countries, 2016-2020, tons, thousand dollars
Table 5. Dynamics and the structure of the Russian MMA import broken down by the countries of origin, 2015-2020, tons, thousand dollars
Table 6. Dynamics and the structure of the Russian MMA import broken down by the manufacturers, 2015-2020, tons, thousand dollars
Table 7. The structure of the MMA average weighted import prices broken down by the manufacturers, 2020, dollars per kg
Table 8. The overall amount of the MMA importing countries, units
Table 9. Dynamics and the structure of the Russian MMA import broken down by the recipients, 2015-2020, tons
Table 10. Dynamics and the structure of the Russian import of the MMA-based acrylic polymers broken down by the recipients, 2015-2020, tons, thousand dollars
Table 11. The TNVED codes used for the acrylic paints import in Russia
Table 12. The main recipients of the acrylic paints, tons, thousand dollars
Table 13. Dynamics and the structure of the Russian market of the MMA, 2015-2020, tons, million rubles
Table 14. The identified MMA consumers broken down by the segments
Table 15. Comparison of the MMA characteristics of the different manufacturers
Table 16. The parameters of the forecast for the MMA prices until 2031
Table 17. The structure of the global import of the esters of methacrylic acid broken down by the importing countries, 2015-2020, thousand tons, million dollars, %
Table 18. Dynamics of the import of the esters of methacrylic acid in the European countries and in the CIS broken down by the countries, share of global import, 2015-2020, tons, thousand dollars
Table 19. The main esters of methacrylic acid importing countries broken down by the supplying countries; average import prices, 2015-2020, tons, dollars per kg
Table 20. The structure of the MMA manufacture in Europe broken down by manufacturers, 2020, thousand tons
Table 21. The PMMA brands of the main manufacturers available on the Russian market
Table 22. Dynamics of the Russian manufacture of the PMMA pellets, 2015-2020, tons
Table 23. Dynamics and the structure of the PMMA export from Russia in the years 2015-2020, tons, thousand dollars
Table 24. Dynamics and the structure of the Russian PMMA export broken down by the manufacturers, 2015-2020, tons, thousand dollars
Table 25. The structure of the average weighted export prices for the PMMA pellets and the PMMA sheets manufactured in Russia, 2020, dollars per kg
Table 26. The characteristics of the main brands of the PMMA sheets manufactured in Russia
Table 27. Dynamics and the structure of the Russian import of the PMMA in primary form and of the PMMA in the form of finished products, 2015-2020, thousand tons, million dollars
Table 28. Dynamics and the structure of the Russian PMMA import broken down by the countries of origin, 2015-2020, tons, thousand dollars
Table 29. The structure of the Russian PMMA import broken down by the manufactures and by the forms, 2015-2020 (in total), tons, % (tons), % (dollars)
Table 30. Dynamics and the structure of the Russian PMMA import broken down by the manufacturers and by the forms, 2015-2020, tons, thousand dollars
Table 31. The amount of the recipients of the imported PMMA pellets and sheets
Table 32. The structure of the Russian PMMA import and top-10 of the recipients broken down by the forms, 2015-2020, tons
Table 33. The import prices for the main brands of the main manufacturers of the PMMA pellets, 2020, dollars per kg
Table 34. Comparison of the characteristics of the main import brands of the PMMA pellets
Table 35. The import prices of the main manufacturers of the PMMA sheets, 2020, dollars per kg
Table 36. Comparison of the characteristics of the main import brands of the PMMA pellets
Table 37. Dynamics and the structure of the Russian market of the PMMA pellets and sheets, 2015-2020, tons, million rubles
Table 38. The identified consumers of the PMMA pellets in the “Manufacture of the PMMA sheets” segment
Table 39. The identified consumers of the PMMA pellets in other segments
Table 40. The identified consumers of the PMMA pellets in the “Trading” segment
Table 41. Characteristics of the PMMA brands manufactured by the HC “Korund”
Table 42. Characteristics of the main brands of the PMMA pellets on the Russian market
Table 43. Characteristics of the main brands of the PMMA sheets on the Russian market
Table 44. The parameters of the forecast for the PMMA pellets prices until 2031
Table 45. The TNVED codes used for the trade of the PMMA
Table 46. The structure of the global PMMA import broken down by the importing countries, 2015-2020, thousand tons, million dollars, %
Table 47. The structure of the global PMMA import broken down by the importing countries and by the PMMA forms, thousand tons, million dollars, %
Table 48. The average weighted import prices for the PMMA pellets and sheets broken down by the importing countries, 2020, dollars per kg
Table 49. Dynamics of the PMMA import in the European countries and in the CIS broken down by the countries, the global import share, 2015-2020, thousand tons, million dollars
Table 50. Dynamics of the PMMA import in the European countries broken down by the main countries and the PMMA forms, 2015-2020, thousand tons, million dollars
Table 51. The main PMMA importing countries broken down by the supplying countries and by the PMMA forms; the average import prices, 2020, thousand tons, million dollars, dollars per kg
Table 52. The structure of the PMMA production capacities in Europe broken down by the manufacturers and by the plants
Table 53. Dynamics and the structure of the PMMA manufacture in Europe broken down by countries and by the manufacturers, the capacity utilization, 2016-2020, thousand tons
Table 54. Dynamics and the structure of the PMMA manufacture in Europe broken down by the countries, by the manufacturers, and by the PMMA types, 2018-2020, thousand tons
Table 55. The projects to expand the existing PMMA production facilities and to create the new PMMA production facilities in Europe
Table 56. The current and projected MMA/PMMA market volumes in Russia, 2020, 2031
Table 57. The scale of hidden MMA/PMMA consumption in Russia
Table 58. The main MMA importing countries, the import volumes
Table 59. The main PMMA importing countries, the import volumes
Table 60. The assessment of the capacity of the MMA/PMMA market for the manufacturers in Russia, thousand tons
Table 61. Comparison of the characteristics of the MMAs of the different manufacturers
Table 62. The characteristics of the extrusive brands of the PMMA
Table 63. The characteristics of the injection molding brands of the PMMA
Table 64. The licensors of the MMA production technology
Table 65. The volume of investments in the projects of creating the MMA production facilities
Diagram 1. Dynamics of the Russian MMA export, 2015-2020, tons, thousand dollars, dollars per kg
Diagram 2. Dynamics of the Russian MMA import, 2015-2020, tons, thousand dollars, dollars per kg
Diagram 3. The structure of the Russian MMA import broken down by countries, 2020, tons, thousand dollars, %
Diagram 4. The structure of the Russian MMA import broken down by the countries, 2015, 2020, tons, %
Diagram 5. The structure of the Russian MMA import broken down by the manufacturers, 2020, tons, thousand dollars, %
Diagram 6. The structure of the Russian MMA import broken down by the manufacturers, 2015, tons, thousand dollars, %
Diagram 7. Dynamics of the Russian import of the MMA-based acrylic polymers
Diagram 8. Dynamics of the Russian import of the acrylic paints, 2015-2020, thousand tons, million dollars
Diagram 9. The structure of the Russian import of the acrylic paints broken down by the recipient type, 2020, thousand tons, million dollars, %
Diagram 10. Dynamics of the Russian MMA market (commodity and non-commodity), 2015-2020, tons
Diagram 11. The structure of the Russian MMA commodity market broken down by the product origin, 2015-2020, tons, % (tons)
Diagram 12. The structure of the Russian MMA manufacture broken down by the shipment destinations, 2015-2020, tons, % (tons)
Diagram 13. The structure of the Russian MMA commodity market broken down by the consumption segments, 2020, % (tons)
Diagram 14. Dynamics of the paints and varnishes manufacture in Russia, 2015-2020, million tons
Diagram 15. Dynamics and the forecast of the house construction in Russia, 2015-2030, million square meters
Diagram 16. Dynamics of the average annual Russian and global MMA prices, 2015-2020, dollars per kg
Diagram 17. Forecast for the average annual Russian MMA prices, 2021-2031, dollars per kg
Diagram 18. Forecast for the Russian MMA commodity market, 2021-2031, thousand tons, million dollars
Diagram 19. Dynamics of the global import of the esters of methacrylic acid, 2015-2020, thousand tons, million dollars
Diagram 20. The structure of the global import of the esters of methacrylic acid broken down by the destination regions, 2020, thousand tons, %
Diagram 21. The structure of the import of the esters of methacrylic acid in the European countries and in the CIS broken down by countries, 2020, thousand tons, %
Diagram 22. Dynamics and the structure of the Russian import of the PMMA pellets and sheets, 2015-2020, tons, %
Diagram 23. Dynamics and the structure of the Russian PMMA import, 2015-2020, thousand tons, dollars per kg
Diagram 24. The structure of the Russian PMMA import broken down by the countries of origin, tons, %
Diagram 25. The main recipients of the imported PMMA, 2020, tons, %
Diagram 26. Dynamics of the Russian market of the PMMA pellets (commodity and non-commodity), 2015-2020, tons
Diagram 27. The structure of the Russian commodity market of the PMMA pellets broken down by the product origin, 2015-2020, tons, % (tons)
Diagram 28. The structure of the Russian manufacture of the PMMA pellets broken down by the shipment destinations, 2015-2020, tons, % (tons)
Diagram 29. The structure of the Russian market of the PMMA sheets broken down by the product origin, 2015-2020, tons, % (tons)
Diagram 30. The structure of the Russian manufacture of the PMMA sheets broken down by the shipment destinations, 2015-2020, tons, % (tons)
Diagram 31. The structure of the Russian commodity market of the PMMA pellets broken down by the consumption segments, 2020, % (tons)
Diagram 32. Dynamics of the average annual Russian and global prices of the PMMA pellets, 2015-2020, dollars per kg
Diagram 33. Forecast for the average annual Russian prices of the PMMA pellets, 2021-2031, dollars per kg
Diagram 34. Forecast for the Russian commodity market of the PMMA pellets, 2021-2031, thousand tons, million dollars
Diagram 35. Dynamics of the global import of the PMMA pellets and sheets, 2015-2020, thousand tons, million dollars
Diagram 36. Dynamics and the structure of the global PMMA import broken down by the product form, 2015-2020, tons, dollars per kg
Diagram 37. Dynamics of the global import of the PMMA pellets and sheets, the average PMMA price, 2015-2020, tons, dollars per kg
Diagram 38. The structure of the PMMA production capacities in Europe broken down by the manufacturers , 2020, thousand tons, %
File name: API-2093