SPECIFICATION
SUMMARY
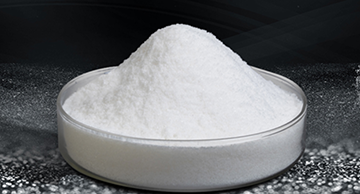
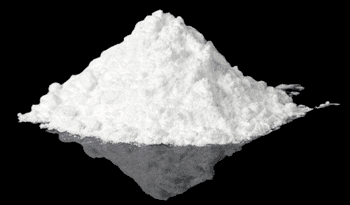
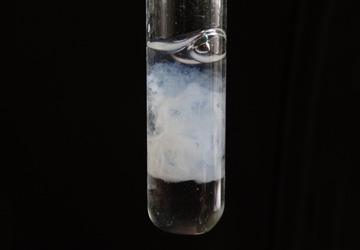
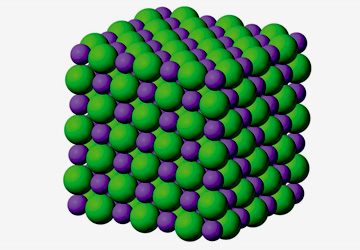
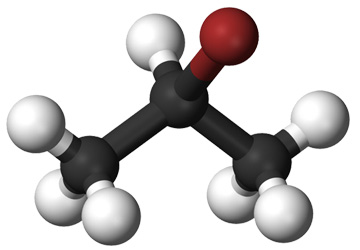
GENERAL PRODUCT INFORMATION
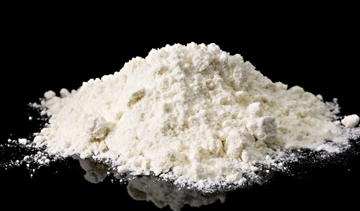
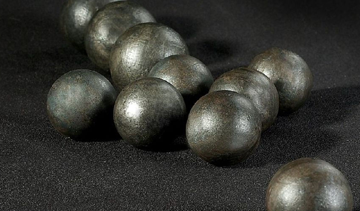
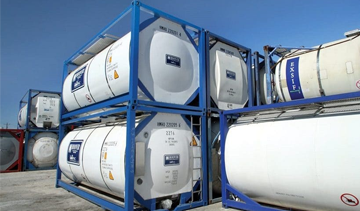
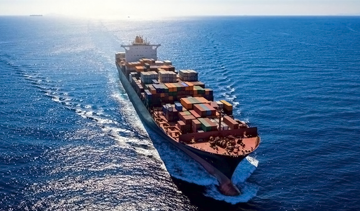
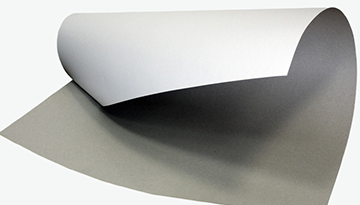
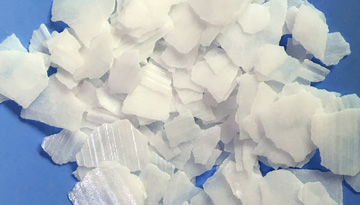
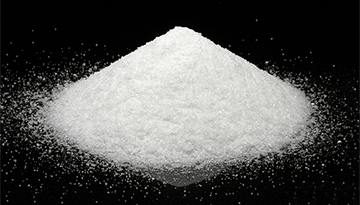
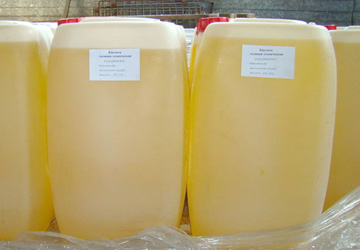
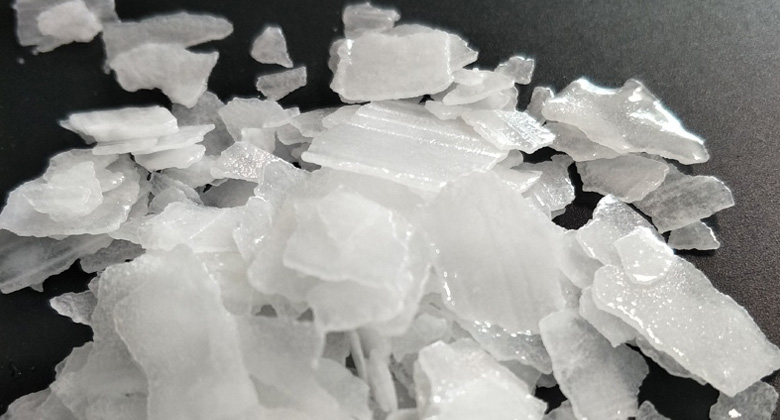
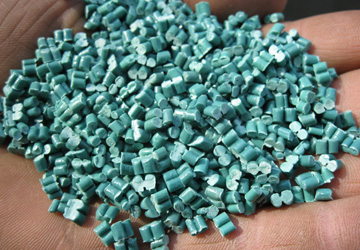
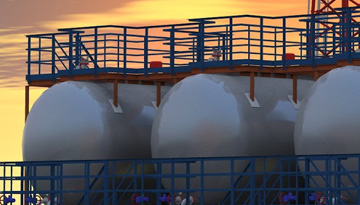
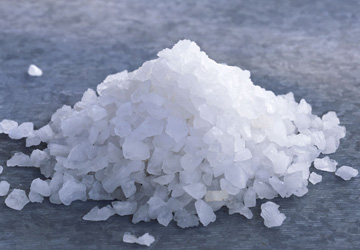
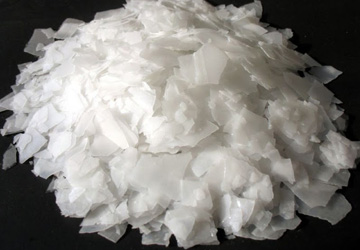
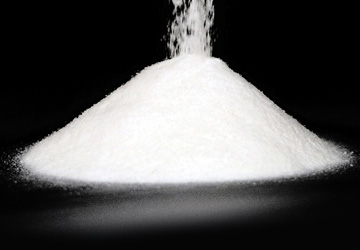
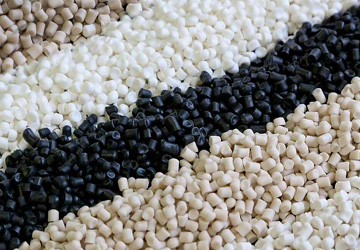
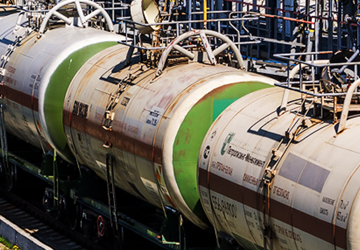
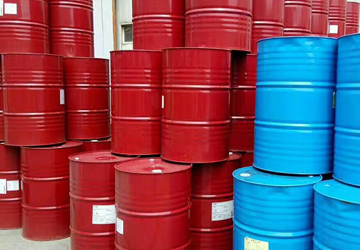
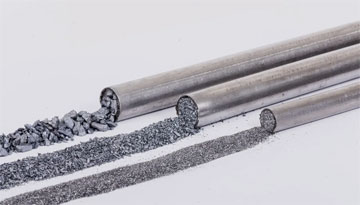
Physical characteristics, commodity forms, transportation options
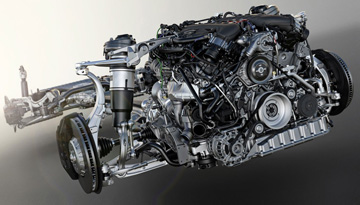
Fields of application
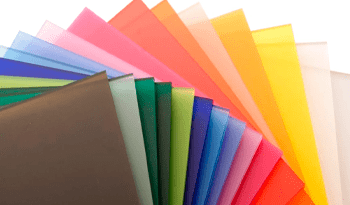
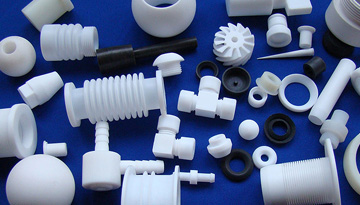
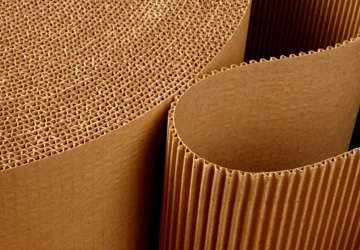
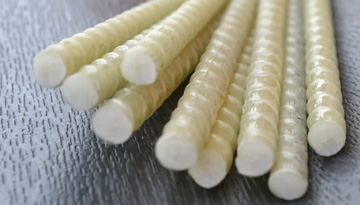
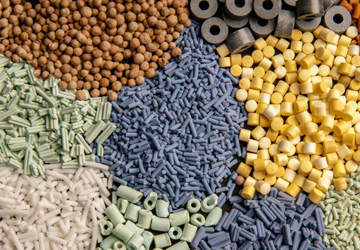
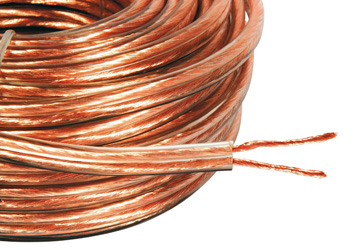
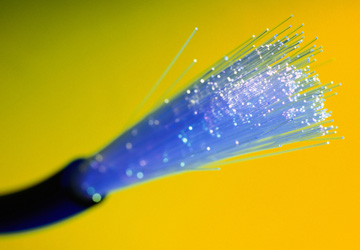
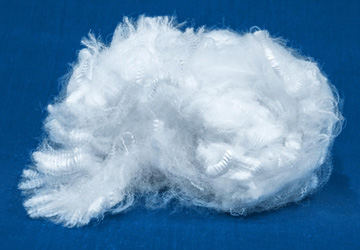
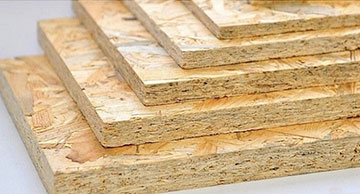
Cellulose and starch derivatives (CMC, PAC, CMS)
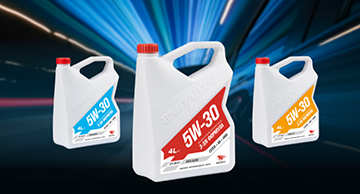
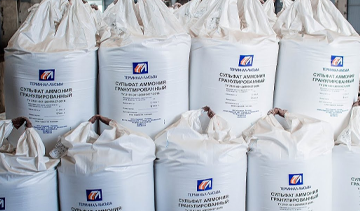
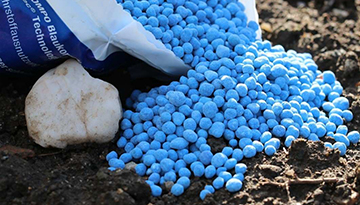
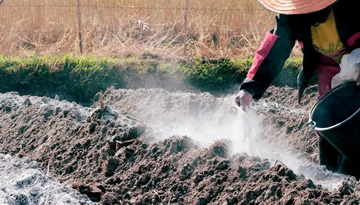
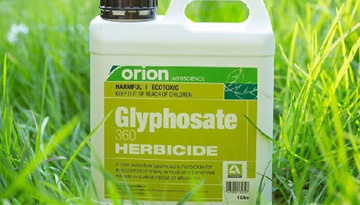
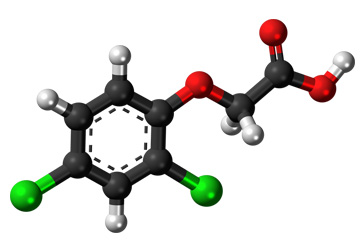
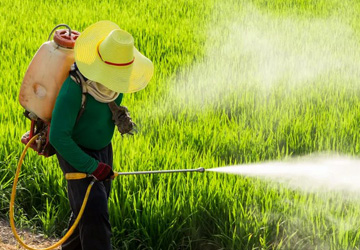
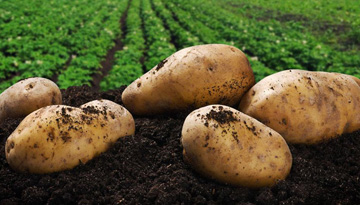
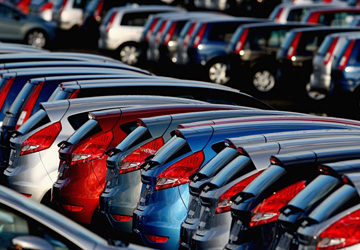
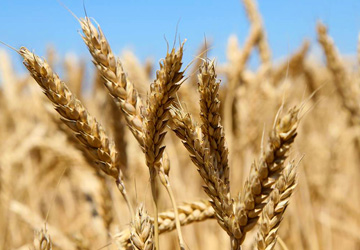
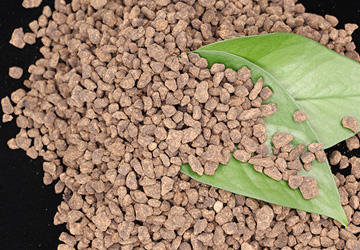
Pesticides (glyphosate, 2,4-D acid and others)
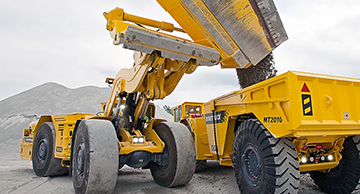
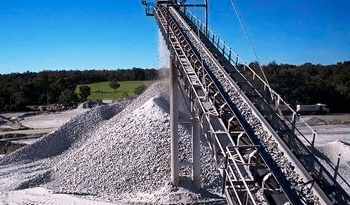
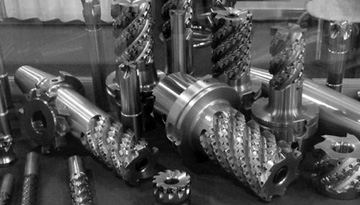
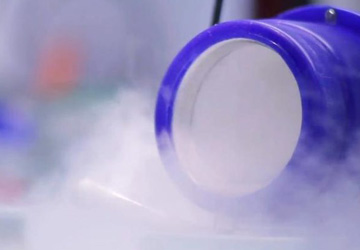
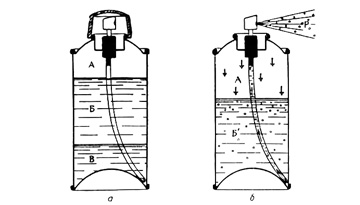
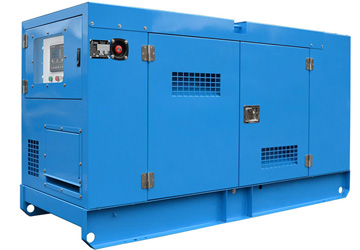
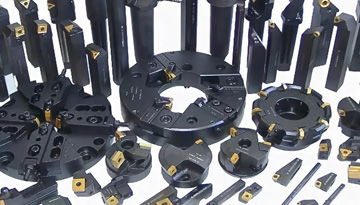
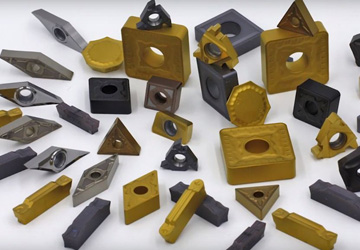
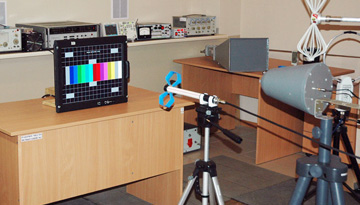
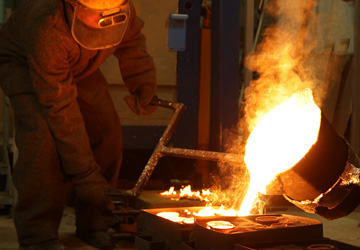
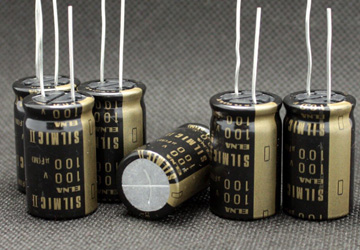
Other areas
SUPPLY OF MCA
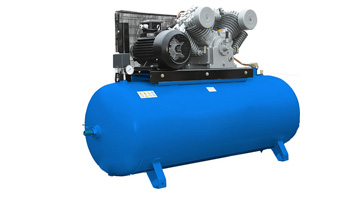
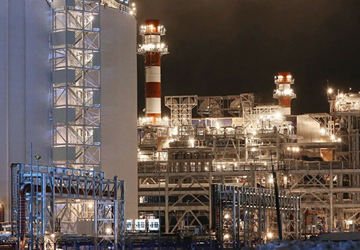
Production in Russia
Russian MCA import
General information about the Russian MCA import
The structure of import broken down by manufacturers
The structure of import broken down by recipients
MCA prices in Russia (broken down by brands and product types)
Prices of the Russian suppliers
Dynamics of import prices
Comparison of import prices and prices of the Russian suppliers
CONCLUSIONS
Demand dynamics of the Russian market
Main sectors of consumption, main consumers
Trading companies
End users, cellulose and starch derivatives (CMC, PAC, CMS)
End users, herbicides
End users, other sectors (glycine etc.)
Forecast of development of the sectors of consumption
Cellulose and starch derivatives (CMC, PAC, CMS)
Pesticides (2,4-Dichlorophenoxyacetic acid, glyphosate)
Other sectors, glycine
Projected volume of potential consumption of MCA up to the year 2026
LIST OF TABLES AND DIAGRAMS
Table 1. Physical and chemical characteristics of monochloroacetic acid
Table 2. Comparison of indicators of commercial MCA grades
Table 3. Application of MCA for cellulose and starch derivatives
Table 4. Application of MCA in the manufacture of pesticides
Table 5. Application of MCA in other areas
Table 6. Projects on organization of the production of MCA in Russia in the years 2002-2019
Table 7. The structure of the Russian MCA import broken down by countries, 2018-2020
Table 8. The structure of the Russian MCA import broken down by manufacturers, 2018-2020
Table 9. The structure of the Russian MCA import broken down by recipients, 2018-2020
Table 10. MCA prices of the Russian suppliers in 2021, rubles per kg
Table 11. Dynamics of import prices broken down by products’ countires of origins, dollars per kg and rubles per kg, 2018-2020
Table 12. Comparison of purchase and shipping prices of the Russian suppliers in the years of 2018-2021
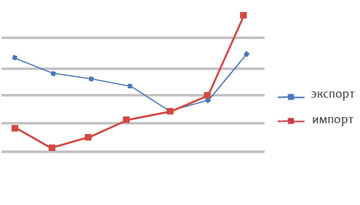
Table 13. Dynamics of import/export by the TNVED code 2915400000, 2011-2020, thousand tons, million dollars
Table 14. Analysis of trading companies, identifying the main consumer segments
Table 15. Analysis of the end users in the “Cellulose and starch derivatives (CMC, PAC, CMS)” segment
Table 16. The characteristics of MCA that was planned to be manufactured at the Kamensky plant
Table 17. Projects on organization of the production of active ingredients of pesticides
Table 18. Research of current and potential consumers of MCA in other sectors, including the manufacture of glycine
Table 19. Dynamics of 2,4-D acid and glyphosate import into Russian Federation in the years 2018-2020, thousand tons, million dollars
Table 20. Dynamics of glycine import into Russian Federation in the years 2018-2020, thousand tons, million dollars
Table 21. Forecast of MCA consumption in the Russian market, thousand tons, million dollars, 2021-2026
Diagram 1. Dynamics of the Russian MCA import, 2018-2020
Diagram 2. The structure of the Russian MCA import broken down by countries, 2018-2020, % (tons, dollars)
Diagram 3. The structure of the Russian MCA import by the groups of recepients, 2018-2020, % (tons, dollars)
Diagram 4. Dynamics of import prices broken down by countires of origins, dollars per kg, 2018-2020
Diagram 5. Dynamics of MCA supplies to FSOE Kamensky plant in the years 2018-2021 (6 month period), tons, dollars per kg, including VAT and delivery cost
Diagram 6. Comparison of purchase and shipping MCA prices of products supplied by “Khimresurs” to FSOE Kamensky plant in the years 2018-2021
Diagram 7. Dynamics of 2,4-D acid and glyphosate import into Russian Federation in the years 2018-2020, thousand tons
Diagram 8. Forecast of MCA consumption in the Russian market, thousand tons, million dollars, 2021-2026