SPECIFICATION
SUMMARY
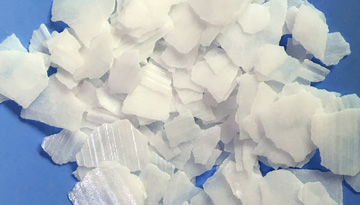
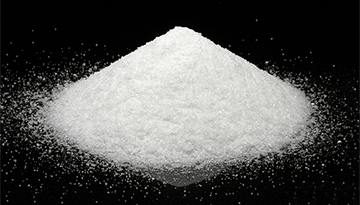
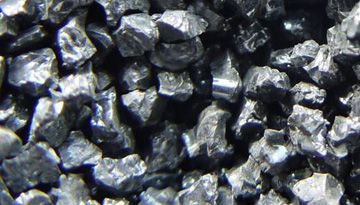
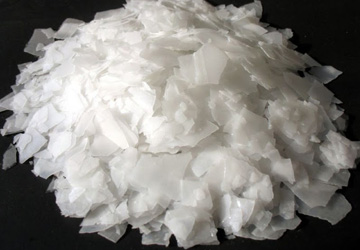
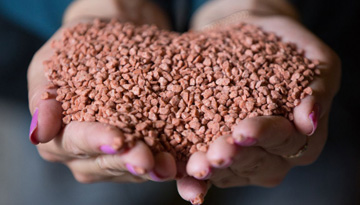
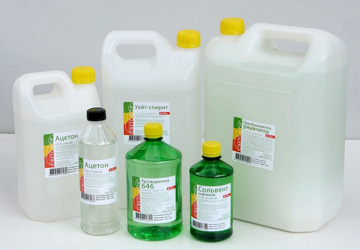
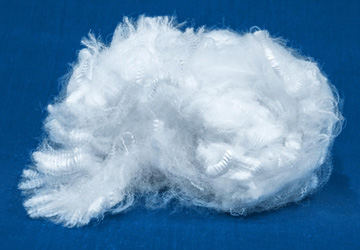
GENERAL PRODUCT INFORMATION
SOLID CAUSTIC MARKET IN RUSSIA, 2017-2020
Solid caustic production in russia, 2017-2020
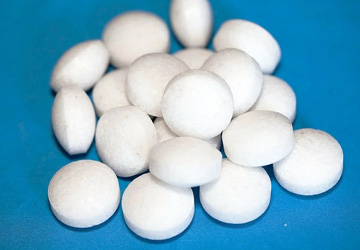
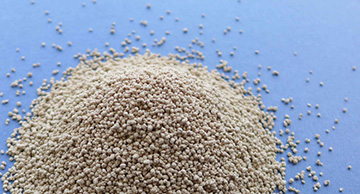
Dynamics of the solid caustic pearls and the solid caustic flakes production volume
Level of capacity utilization of current manufacturers
Plans on the development of solid caustic production by its manufacturers and by the liquid caustic manufacturers
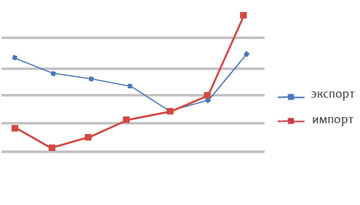
The volume of Russian solid caustic import and export, 2017-2020
The total volume of the Russian solid caustic market, 2017-2020
SOLID CAUSTIC MARKET IN THE CIS AND EU COUNTRIES. ASSESSMENT OF RUSSIA’S EXPORT CAPACITY
Supply of solid caustic to the CIS and EU countries from other countries, 2017-2020
Major net solid caustic importing countries
Primary supplying and importing countries, the share of solid caustic import from Russia
The weighted average purchase price levels by country
Domestic production of solid caustic in the CIS and EU countries
Primary producers (location, the scale of activity)
Solid caustic production development plans in the CIS and EU countires
The most promising countries for the export from Russia, with consideration of logistics, import price levels, and domestic production
CONSUMERS OF SOILD CAUSTIC IN RUSSIA AND THE CIS COUNTRIES
Consumers of solid caustic in russia
Ore mining
Concrete additives
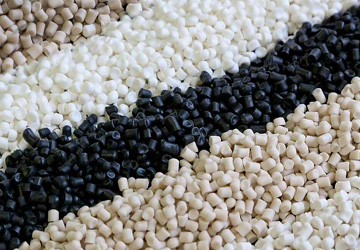
Chemical industry
Production of household chemicals
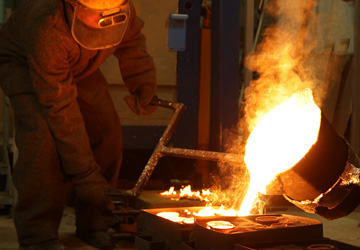
Metallurgy and metalworking
Food industry
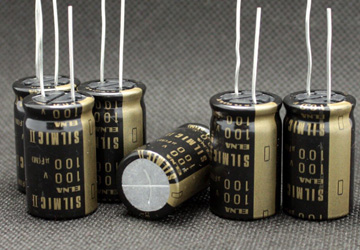
Power engineering
Oil refining
Pulp and paper industry
Fertilizer production
Other industries
Trading companies
Prospects for the soild caustic market development
Recipients of a solid caustic in the CIS countries
General parameters of the solid caustic consumption
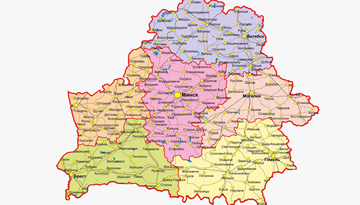
Belarus
Uzbekistan
Kazakhstan
Ukraine
LIST OF TABLES AND DIAGRAMS
Table 1. Caustic soda brands in accordance with GOST R55064-2012, GOST 11078-78
Table 2. Brands of the solid caustic pearls and the solid caustic flakes manufactured in russia (STO 00203275-206-2007, STO 00203312-017-2011)
Table 3. Dynamics and the structure of solid caustic production in russia by manufacturers and solid caustic types, 2017-2020, thousand tons
Тable 4. Productive capacity and capacity utilization dynamics of the solid caustic manufactures in russia, 2017-2020, thousand tons, %
Table 5. Plans of the caustic soda manufactures on development of the solid caustic manufacture
Тable 6. The structure and dynamics of the russian caustic import and export broken down by physical form, 2017-2020, tons, thousand dollars
Table 7. The structure and dynamics of the russian solid caustic import and export broken down by countries, 2017-2020, tons, thousand dollars
Table 8. The structure and dynamics of the russian solid caustic import and export broken down by the caustic types, 2017-2020, tons, thousand dollars
Table 9. Dynamics of average weighted import and export solid caustic prices broken down by the caustic types, 2017-2020, dollars per ton
Table 10. The structure and dynamics of the russian solid caustic import broken down by recipients, 2017-2020, tons, thousand dollars
Table 11. The structure and dynamics of the russian solid caustic market broken down by the caustic types, 2017-2020, thousand tons, million dollars, million rubles
Table 12. The structure and dynamics of the solid and liquid caustic net import broken down by countries, 2017-2020, thousand tons, million dollars
Table 13. The structure and dynamics of the solid caustic net import broken down by countries, 2017-2020, thousand tons, million dollars
Table 14. The structure and dynamics of the solid caustic net import broken down by the EU and CIS countries, 2017-2020, thousand tons, million dollars
Table 15. Dynamics of the solid caustic net import broken down by the main solid caustic recepient countries with an indication of the supplier countries, 2017-2020, tons, thousand dollars
Table 16. The structure and dynamics of average weighted import solid caustic prices broken down by the recepient countries, 2017-2020, thousand tons, dollars per kg
Table 17. The structure of european solid caustic manufacture broken dow n by manufacturers
Table 18. The soild caustic production structure at AO “Caustic” (Pavlodar), tons/dollars, 2017-2020
Table 19. IDentification of the promising countries for the soild caustic export from Russia to the CIS and EU countries, including purchasing price level and distance
Table 20. Caustic consumption parameters on the russian market.
Table 21. Caustic consumption parameters in the “Ore mining” segment, 2020
Table 22. Supply of caustic soda for mining companies, 2020
Table 23. Caustic consumption parameters in the “Concrete additives” segment, 2020
Table 24. Supply of caustic soda for concrete additives manufactures, tons, 2020
Table 25. Caustic consumption parameters in the “Chemical industry” segment, 2020
Table 26. Caustic consumption in the “Chemistry” segment, 2020
Table 27. Solid caustic consumption in the “Chemistry” segment, 2020, other companies
Table 28. Caustic consumption parameters in the “Household chemicals” segment, 2020
Table 29. Caustic consumption in the “Household chemicals” segment, 2020
Table 30. Caustic consumption parameters in the “Metallurgy and metalwork” segment, 2020
Table 31. Supply of caustic soda for the “Metallurgy and metalwork” segment companies, 2020
Table 32. Caustic consumption parameters in the “Food industry” segment
Table 33. Supply of caustic for the “Food industry” segment consumers, tons, liquid/solid, 2020
Table 34. Caustic consumption parameters in the “Power engineering” segment, 2020
Table 35. Supply of caustic soda for energy companies, 2020
Table 36. Caustic consumption parameters in the “Oil refining” segment
Table 37. Supply of caustic soda for oil plants, 2020
Table 38. Caustic consumption parameters in the “Pulp and paper mills” segment
Table 39. Supply of caustic soda for pulp and paper mills, tons, 2020 (sorted by revenue)
Table 40. Caustic consumption parameters in the “Production of fertilizers” segment
Table 41. Supply of caustic soda for phosphate fertilizer manufactures, 2020
Table 42. Caustic consumption parameters in the “Other industries” segment
Table 43. Supply of caustic soda for the “Other industries” segment companies, 2020
Table 44. Procurements of solid caustic soda for trading companies, 2020
Table 45. Caustic consumption parameters broken down by segments, amendments to procurement plans
Table 46. Soild caustic consumption parameters in the CIS countries
Table 47. Assessment of the restrictions and advantages of the supply of solid caustic from Russia to the CIS countries
Table 48. Solid caustic demand parameters in Belarus
Table 49. Identified supply of caustic for the consumers in Belarus
Table 50. Solid caustic demand parameters in Uzbekistan
Table 51. Identified supply of caustic for the consumers in Uzbekistan
Table 52. Soild caustic demand parameters in Kazakhstan
Table 53. Identified supply of caustic for the consumers in Kazakhstan
Table 54. Soild caustic demand parameters in Ukraine
Table 55. Identified supply of caustic for the consumers in Ukraine
Diagram 1. Dynamics and the structure of solid caustic production in Russia by solid caustic types, 2017-2020, thousand tons
Diagram 2. The structure and dynamics of the Russian solid caustic market broken down by the caustic types, 2017-2020, thousand tons, %
Diagram 3. The structure and dynamics of the Russian solid caustic market broken down by the product\s origin, 2017-2020, thousand tons, %
Diagram 4. The Structure and dynamics of the Russian solid caustic market broken down by the delivery destinations, 2017-2020, thousand tons, %
Diagram 5. Dynamics of solid caustic production in Europe (excluding the CIS countries), 2008-2019, thousand tons
Diagram 6. The structure of solid and liquid caustic production in Europe (excluding the CIS countries) broken down by the caustic types, 2019, thousand tons, %