Methodology
• Analysis of statistical data, specialized literature and website data of manufacturing companies and LPG consumers;
• information of companies offering solutions for transportation and storage of LPG;
• analysis of foreign economic activity
CONTENTS
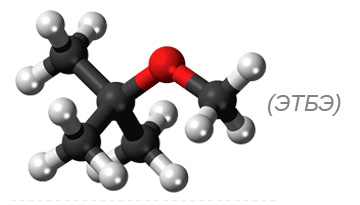
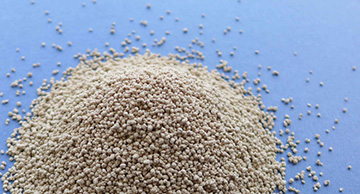
GENERAL INFORMATION ON LIQUEFIED PETROLEUM GASES
TRENDS OF GLOBAL MARKET DEVELOPMENT
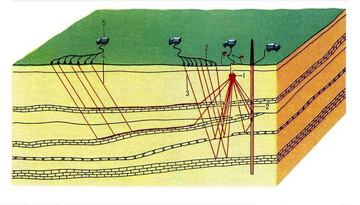
DYNAMICS AND STRUCTURE OF PRODUCTION
CONSUMPTION
Consumption structure
Consumption dynamics
INTERNATIONAL TRADE
DEMAND AND SUPPLY BALANCE
PRICES
RUSSIAN MARKET
STANDARDS OF LPG QUALITY
DYNAMICS AND STRUCTURE OF LPG PRODUCTION
LPG production dynamics by regions and companies
Dynamics of commodity products manufacturing
Structure of LPG production by components
CONSUMPTION OF LIQUEFIED PETROLEUM GASES IN THE RUSSIAN FEDERATION
Dynamics and consumption structure
INTERNATIONAL TRADE
State regulation System for LPG export
Dynamics and geographical export structure
Structure of LPG export on industries and components
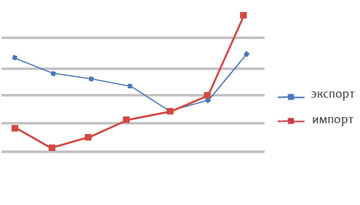
Dynamics and structure of import
DEMAND AND SUPPLY BALANCE
PRICES
Price regulation in domestic LPG market
Price dynamics
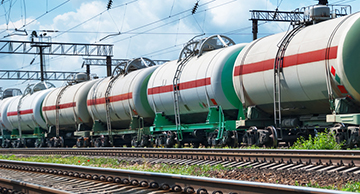
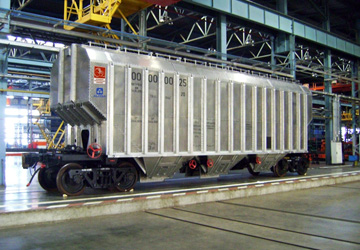
TRANSPORTATION OF LIQUEFIED PETROLEUM GASES
Features of transportation
Operators of tanks for LPG transportation
Largest railway carriers
Structure and dynamics of railway transportation
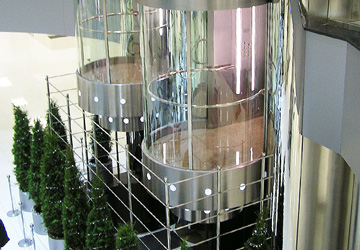
MANUFACTURERS OF THE EQUIPMENT FOR STORAGE AND TRANSPORTATION OF LPG
"KVSK" - A BRANCH OF JSC "ALTAYSKOYE VAGONOSTROENIE"
JSC "GT7"
JSC "BETSEMA"
LLC "YUGNEFTEKHIMMASH"
"TRANSMASH" LLC
FLUSSIGGAS ANLAGEN GMBH (FAS)
ENGINEERING COMPANIES -
JSC "SEVERNOYE"
LLC "ALEKSANDROVSKAYA GAZOVAYA KOMPANIYA "BLIK"
APPENDICES
Appendix 1. Dynamics of average monthly price prices in selected countries of the world, dec. 2012 - dec. 13, USD / ton
Appendix 2. Dynamics of average monthly prices for butane in selected countries of the world, dec. 2012 - dec. 13, USD / ton
Appendix 3. GOST 20448-90 "fuel liquefied petroleum gases for commodity consumer consumption" Technical conditions"
Appendix 4. Largest LPG manufacturers in the Russian Federation
Appendix 5. Largest consumers of LPG in petrochemicals
Appendix 6. Regulations for the transport of explosive and flammable substances and materials
Appendix 7. Contact information on "SG-Trans" branches
Appendix 8. Parameters of planned oil-gas-chemical clusters in Russia
Appendix 9. Contact information on manufacturers of equipment for LPG transportation and storage
LIST OF TABLES AND DIAGRAMS
Table 1. Planned construction of propane dehydrogenation units in the USA, 2014-18, thousand tons / year
Table 2. Planned construction of propane dehydrogenation plants in China, 2013-18, thousand tons / year
Table 3. Grades of liquefied petroleum gases
Table 4. Technical requirements for exported LPG
Table 5. Quality indicators of PPF (propane-propylene fraction)
Table 6. The Russian LPG market according to the data of the Central Control Administration of the Fuel and Energy Complex and State Statistics, 2013.
Table 7. Structure of LPG consumption by major consumers, 2013, thousand tons
Table 8. Forecast of the Russian LPG market up to 2020
Table 9. Technical characteristics of equipment for transportation and storage of LPG of KVSK company
Table 10. Parameters of cylindrical vessels for land storage of LPG produced by KVSK
Table 11. Parameters of tanks for underground storage of LPG produced by KVSK
Table 12. Technical characteristics and cost of equipment manufactured by JSC "Betsema"
Table 13. Technical characteristics of equipment for transportation and storage of LPG of "YUGNEFTEKHIMMASH" company
Table 14. Technical characteristics of LPG equipment produced by LLC "TransMash"
Table 15. Technical characteristics of FAS-НС tanks for land storage of LPG produced by FAS
Table 16. Technical characteristics of FAS-ПС tanks for underground storage of LPG produced by FAS
Table 17. Name and national product classification code
Table 18. Application of various grades of liquefied gas for domestic consumption
Table 19. Quality indicators of technical propane
Table 20. Quality indicators of technical butane
Table 21. Quality indicators of technical propane butane mixture
Diagram 1. CO2 emissions in the production and use of natural gas, LPG, diesel fuel and gasoline, kg CO2 equivalent / BTU
Diagram 2. Dynamics of global LPG production, 2000-13, forecast to 2020, million tons
Diagram 3. Dynamics of LPG production by regions of the world, 2008-13, forecast to 2020, million tons
Diagram 4. Average annual increase in LPG production by regions of the world, 2000-2010, forecast for 2010-2020,% per year
Diagram 5. Dynamics of liquid fuels production in North America, 2000-13, forecast to 2025, million barrels / day
Diagram 6. Dynamics of LPG production in the US in terms of components, 2005-12, million barrels / day
Diagram 7. Change in the structure of LPG production by regions of the world, 2013-18, million tons,%
Diagram 8. Change in the structure of LPG production in the Middle East by main producing countries, 2011-15, million tons
Diagram 9. Dynamics of LPG production in South-East Asia by main producing countries, 2005-13, 2014 estimate, million tons
Diagram 10. Forecast of LPG production by regions of the world up to 2030, million tons
Diagram 11. Change in the structure of LPG production in the world, 2005-13, forecast to 2017 million tons
Diagram 12. Reserves of potential shale gas producers in the world, thousand cubic feet
Diagram 13. Dynamics of LPG manufacture in a cut on raw material, 2000-12, the forecast till 2030, million tons
Diagram 14. Change in the structure of global consumption of LPG, 2000-13, estimate 2014, million tons
Diagram 15. The structure of global LPG consumption, 2013, million tons,%
Diagram 16. Dynamics of prices for propylene in Southeast Asia, propane in Saudi Arabia and the cost of PHD propylene in the Middle East, 2000-12, USD / ton
Diagram 17. The cost structure of propylene in the US and the Middle East, 2012, USD / ton
Diagram 18. Price dynamics of butadiene and the cost of its production from butane and butene, 2000-12, USD / ton
Diagram 19. Sales dynamics of new cars on propane in the USA, 2005-12, the forecast till 2020, thousand pcs
Diagram 20. Quantity change of passenger cars on LPG by leading consumers in Europe, 2005-11, pcs
Diagram 21. Change of consumption structure for LPG by inductries in Europe, 2013-20, million tons,%
Diagram 22. Consumption dynamics of LPG in Europe by segment, 2001-13, forecast to 2020, million tons
Diagram 23. Dynamics of global LPG consumption, 2000-13, forecast to 2020, million tons
Diagram 24. Geographic structure of global LPG consumption, 2013, million tons,%
Diagram 25. Dynamics of LPG consumption in the breakdown by regions of the world, 2000-13, forecast to 2020, million tons
Diagram 26. Average annual increase / decrease in LPG consumption by regions of the world, 2000-10, forecast for 2010-20,% per year
Diagram 27. Dynamics of global LPG exports by exporting regions, 2000-2010, forecast to 2014, million tons
Diagram 28. Forecast of LPG exports to 2030, million tons
Diagram 29. Export of LPG by fractions, 2012,%
Diagram 30. Change in the component structure of LPG exports, 2008-12,%
Diagram 31. Geographical structure of LPG export, 2012, thousand tons,%
Diagram 32. Dynamics of LPG exports by exporting regions, 2008-2012, million tons
Diagram 33. Foreign trade dynamics for LPG of USA, 2007-2013, million tons
Diagram 34. Exports and imports dynamics for LPG of USA by products, 2007-2013, million tons
Diagram 35. Foreign trade dynamics for propane of USA, 2000-2012, forecast to 2020, million gallons
Diagram 36. Geographical structure of LPG import, 2012, thousand tons,%
Diagram 37. Purchases of LPG of the largest importers in terms of products, 2012, million tons
Diagram 38. Import dynamics of LPG of EU-27 countries by product, 2005-12, million tons
Diagram 39. Foreign trade balance change for LPG of the EU countries, 2007-12, million tons
Diagram 40. Import dynamics for LPG of EU-27 countries by suppliers, 2000-12, thousand tons
Diagram 41. Dynamics of LPG export marine shipments by exporting regions, 2009-12, forecast to 2020, million tons
Diagram 42. The basic directions of sea transportations of LPG by regions, 2013,% (billion tons-miles)
Diagram 43. Change in the balance of demand and supply of LPG in the global market, 2005-13, forecast to 2020, million tons
Diagram 44. The forecast of change in the balance of demand and supply by regions of the world, 2013-20, million tons
Diagram 45. Change in average annual prices of single transactions for oil (FOB Texas (WTI), USD / barr.) and propane (FOB Mont Belvieu (TX), USD / ton) in the USA in 2003 -13.
Diagram 46. Dynamics of prices for propane in Europe, 2011-13, USD / ton
Diagram 47. Dynamics of prices for butane in Europe, 2011-13, USD / ton
Diagram 48. Dynamics of average monthly prices for propane and butane in the Far East, Argus estimate, 2011-13 yr., USD / ton
Diagram 49. Dynamics of import prices for LPG of EU countries, 2000-12, USD / ton
Diagram 50. Dynamics of export and import prices for LPG of USA, 2007-12, USD / ton
Diagram 51. Dynamics of LPG production in the Russian Federation, 2000-2013, forecast up to 2020, million tons
Diagram 52. Dynamics of LPG production by federal districts of the RF, 2008-13, thousand tons
Diagram 53. LPG production by federal districts of the RF according to the data of the Central Control Administration of the Fuel and Energy Complex and Rosstat, 2013, thousand tons,%
Diagram 54. Change of production structure for LPG by inductries, 2008-13, thousand tons,%
Diagram 55 Dynamics of LPG manufacture by basic companies-manufacturers (at a holding level), 2008-13, thousand tons
Diagram 56. Capacity dynamics of SIBUR gas refinery plants, 2010-12, the forecast till 2020, billion cubic meter / year
Diagram 57. Dynamics of LPG manufacture on Gazprom gas refinery plants, 2007-13, thousand tons
Diagram 58. LPG production by the largest oil and gas companies, 2012-13, thousand tons
Diagram 59. Structure of industry production of LPG by companies, 2013,%
Diagram 60. Dynamics of LPG manufacture and deliveries of commodity product, 2007-13, million tons
Diagram 61. Dynamics of LPG supplies to the domestic market, 2007-13, thousand tons
Diagram 62. Manufacture of commodity product and LPG deliveries to the domestic market, 2013, thousand tons of tons,%
Diagram 63. Change of manufacture structure for LPG by basic components, 2008-13, thousand tons,%
Diagram 64. Structure of LPG manufacture by basic components, 2013, thousand tons
Diagram 65. Component structure of LPG production in Russia by industries, 2013, thousand tons,%
Diagram 66. Dynamics of LPG consumption in Russia, 2000-2013, forecast to 2020, million tons
Diagram 67. Dynamics of LPG consumption in the Russia according to the Central Control Administration of the Fuel and Energy Complex and the State statistics, 2007-13, thousand tons
Diagram 68. Dynamics of LPG consumption in Russia by sectors, 2000-2013, forecast to 2020, thousand tons
Diagram 69. Structure of LPG consumption in Russia, 2013, million tons,%
Diagram 70. Dynamics of LPG processing in petrochemistry in a cut on sources of deliveries, 2008-13, million tons
Diagram 71. Structure of pipeline LPG deliveries on in a cut on components, 2013, thousand tons,%
Diagram 72. Structure of LPG processing in petrochemistry of Russia, 2013,%
Diagram 73. Structure change of LPG processing in petrochemistry of Russia, 2008-13, the forecast till 2020, thousand tons,%
Diagram 74. The largest firms processing LPG in petrochemical sector of Russia, 2010-12, thousand tons
Diagram 75. Dynamics of LPG supplies in Russia at regulated prices, 2007-12, thousand tons,%
Diagram 76. Dynamics of LPG consumption in a municipal household sector for the population, 2007-13, thousand tons
Diagram 77. Consumption of LPG in motor transport by federal districts of the Russian Federation, 2013,%
Diagram 78. Dynamics of LPG consumption in motor transport by federal districts of the Russian Federation, 2008-13,%
Diagram 79. Change of LPG processing structure, 2007-13, million tons,%
Diagram 80. Inductry structure of intrafactory consumption of LPG, 2008-2013, thousand tons,%
Diagram 81. Intrafactory consumption of LPG by components, 2013, thousand tons,%
Diagram 82. LPG processing for own needs of manufacturers in a cut on industries, 2012, one million tons,%
Diagram 83. Intrafactory LPG processing in a cut on industries and fractions, 2013, thousand tons
Diagram 84. Change of LPG consumption structure in the Russian internal market, 2007-13, million tons,%
Diagram 85. Structure of petrochemical processing of LPG in the domestic market of Russia, 2013, thousand tons,%
Diagram 86. Structure of rail transportation of LPG in a cut on components, 2013, thousand tons,%
Diagram 87. Export duties for LPG, 2012-14, USD / ton
Diagram 88. Export of LPG from Russia according to the data of the Central Control Administration of the Fuel and Energy Complex and the State Customs Committee of the Russian Federation, million tons
Diagram 89. Dynamics of Russian LPG export in the context of importing regions, 2007-13, thousand tons
Diagram 90. Structure of the Russian export of LPG in a cut on leading importing countries, 2013, thousand tons,%
Diagram 91. Dynamics of Russian LPG exports by importing countries, 2007-13, thousand tons
Diagram 92. Structure change of LPG export from the Russian Federation by industries, 2007-13, thousand tons
Diagram 93. Dynamics of LPG exports from Russia by exporting holding companies, 2007-13, thousand tons
Diagram 94. Structure of LPG export in a cut on holdings, 2013, thousand tons,%
Diagram 95. Change in the share of LPG exports from Russia by leading exporters, 2007-13,% of RF exports
Diagram 96. Dynamics of LPG exports by main components, 2007-13, thousand tons
Diagram 97. Structure of LPG export in a cut on products, 2013, thousand tons,%
Diagram 98. Change of export share of LPG deliveries by basic industries, 2007-13,% from export volume of the Russian Federation
Diagram 99. Importance of import in consumption of LPG of Russia, 2013, thousand tons,%
Diagram 100. Balance of supply and demand of LPG in Russia, 2007-13, million tons
Diagram 101. Change in the balance of demand and supply of LPG in Russia, 2007-13, million tons
Diagram 102. Balance of demand and supply of LPG in Russia by products, 2013, million tons
Diagram 103. Change of LPG excesses in the Russian market up to 2015 according to SIBUR forecast, million tons
Diagram 104. The forecast of change of APG processing structure in the Russian Federation up to 2015, billion cubic meters,%
Diagram 105. Structure of LPG deliveries of SIBUR holding, 2013, thousand tons,%
Diagram 106. Manufacture dynamics of olefins in Russia, 2008-13, the forecast till 2020, thousand tons
Diagram 107. The change forecast for balance of supply and demand of LPG in Russia, 2015-20, million tons,%
Diagram108. Dynamics of average annual regulated and average wholesale prices for LPG, 2005-13, thousand RUR / ton (excluding VAT)
Diagram 109. Dynamics of commercial LPG prices in comparison with the prices for balance orders by regions of the Russian Federation, 07.2012-06.2013, RUR / kg
Diagram 110. Comparison of market prices for LPG with prices for balance orders for some suppliers, 2nd half 2012 - 1st half 2013, RUR / kg
Diagram 111. Change in selling prices for technical propane butane mixture by producers, 2012-13, thousand RUR / ton
Diagram 112. Dynamics of small wholesale prices for LPG in comparison with producer prices, 09.2012-01.2013, thousand RUR / ton
Diagram 113. Price dynamics of the Russian domestic market and export prices for technical propane butane mixture, 2007-13, thousand RUR / ton
Diagram 114. Price dynamics of the Russian domestic market and export prices for n-butane and isobutane, 2010-13, thousand RUR / ton
Diagram 115. Price dynamics of the Russian domestic market and export prices for propane and PPF, 2010-13, thousand RUR / ton
Diagram 116. Structure of rail carriers LPG in Russia
Diagram 117. The largest carriers of LPG in the Russian Federation, 2013, thousand tons,%
Diagram 118. Dynamics of railway transportations by industries, 2008-13, thousand tons
Diagram 119. Change in the share of LPG rail transportation by regions of consumption, 2008-13,%
Diagram 120. Structure of rail transportation of LPG in a cut on federal districts and consumers, 2013, thousand tons
Diagram 121. Changes in the structure of LPG rail transportation in terms of components, 2008-13, thousand tons, %