Specification
Summary
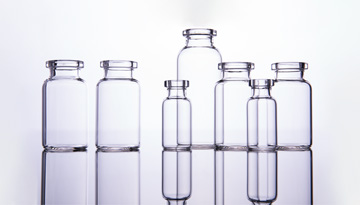
Analysis of Russian imports of glass tube medical containers
Analysis of the structure of imports of medical products from glass tubes and raw materials, 2020 – first 8 months of 2022
General dynamics of imports and structure by product types, 2020 – first 8 months of 2022
Structure by countries of origin, 2020 – first 8 months of 2022
Detailed analysis of the structure of imports of glass tubing medical products and raw materials, 2020 – first half of 2022
Structure of imports by types of products
The structure of imports in the context of the capacity of vials / ampoules
Structure of imports by countries of origin and producers
Import structure by recipients
The level of import prices for medical glass containers
General dynamics of prices for glass tube medical products and raw materials, 2020 – first 8 months of 2022
Detailed price dynamics for glass tubing medical products and raw materials, 2020 – first half of 2022
Changes related to February 2022 events
Analysis of the Russian production of medical containers made of glass tubes
Total volume and dynamics of Russian production in 2020 – first half of 2022
Structure of Russian production by enterprises, level of capacity utilization
Export prices of Russian manufacturers
Analysis of Russian exports of glass medical containers
Total volume and dynamics of exports in 2018-2020
Structure of exports by countries of destination
Structure of exports by manufacturers and types of medical containers
Analysis of the Russian market of medical glass containers
Total volume and dynamics of the Russian market in 2020 – first half of 2022
Distribution of market shares among key players
Assessing the impact of February 2022 events on individual manufacturers and the market
Appendices
Appendix 1. Assessment of the structure of imports of glass products by color
Appendix 2. The structure of imports of medical products from glass tubes by recipients and main suppliers
Appendix 3. The structure of imports of medical products from glass tubes by main containers and manufacturers
Appendix 4. Structure of import prices, addition
Appendix 5. Structure of export prices, addition
LIST OF TABLES AND DIAGRAMS
Table 1. Dynamics and structure of Russian imports of medical products from glass tubes and raw materials, 2020-first 8 months of 2022, tons, thousand dollars
Table 2. Dynamics and structure of Russian imports of medical products made of glass tubing and raw materials by product types and months, 2022, tons, thousand dollars
Table 3. Dynamics and structure of Russian imports of medical products made of glass tubing and raw materials by product types and months, 2022, tons, thousand dollars
Table 4. Dynamics and structure of Russian imports of glass tube medical products by countries of origin, first 8 months of 2021/ first 8 months of 2022, tons, thousand dollars
Table 5. Dynamics and structure of Russian imports of glass tube bottles by countries, manufacturers and months, 2022, tons
Table 6. Dynamics and structure of Russian imports of glass tube ampoules by countries, manufacturers and months, 2022, tons
Table 7. Dynamics and structure of Russian imports of glass tube cartridges by countries, manufacturers and months, 2022, tons
Table 8. Dynamics and structure of Russian imports of glass pipes by country of origin, first 8 months of 2021/ first 8 months of 2022, tons, thousand dollars
Table 9. Dynamics and structure of Russian imports of glass pipes (raw materials) by countries, producers and months, 2022, tons
Table 10. Dynamics and structure of Russian imports of glass medical products by product types, 2018 – first half of 2022, tons, thousand dollars, million units
Table 11. Dynamics and structure of Russian imports of glass tube bottles by capacity, 2020 – first half of 2022, tons, thousand dollars, million units
Table 12. Dynamics and structure of Russian imports of ampoules by capacity, 2020 – first half of 2022, tons, thousand dollars, million units
Table 13. Dynamics and structure of Russian imports of medical products made of glass tubes by countries of origin, 2020 – first half of 2022, tons, thousand dollars, million units
Table 14. Dynamics and structure of Russian imports of glass pipes by countries of origin, 2020 – first half of 2022, tons, thousand dollars
Table 15. Dynamics and structure of Russian imports of glass tube medical products by manufacturers, 2020 – first half of 2022, tons, thousand dollars
Table 16. Dynamics and structure of Russian imports of medical products made of glass tubes by types of products and manufacturers, 2020 – first half of 2022, tons, thousand dollars, million units
Table 17. Dynamics and structure of Russian imports of glass tube medical products by recipients, 2020 – first half of 2022, tons, thousand dollars
Table 18. The structure of Russian imports of medical products made of glass tubes by recipients, types of products and main suppliers, 2021, tons, thousand dollars, million units
Table 19. The structure of Russian imports of raw materials for the production of medical glass products by recipients and main suppliers, 2020 – first half of 2022, tons, thousand dollars
Table 20. Dynamics and structure of import prices for medical devices made of glass tubing and raw materials by country of origin, 2020 – first 8 months of 2022, tons, dollars per kg
Table 21. Monthly dynamics of import prices for medical products made of glass tubing and raw materials by product type, first 8 months of 2022, dollars per kg, rubles per kg
Table 22. Dynamics of prices for medical products made of glass tubes by capacity, 2020 – first half of 2022, dollars per kg, cents per unit
Table 23. Dynamics of prices for glass tube bottles by main containers and manufacturers, 2020 – first half of 2022, dollars per kg, cents per unit
Table 24. Dynamics of prices for ampoules in the context of the main containers and manufacturers, 2020 – first half of 2022, dollars per kg, cents per unit
Таble 25. Dynamics of prices for glass tubes by main diameters, 2020 – first half of 2022, dollars per kg
Table 26. Price dynamics for glass tubes produced by Schott AG by color, 2020 – first half of 2022, dollars per kg
Table 27. EU sanctions on import/export to Russia, approved on 08 April 2022
Table 28. The impact of the events of February 2022 on the import of glass tubing medical products and raw materials
Table 29. Dynamics and structure of the Russian production of glass medical products by product types, 2018-2020, tons, million rubles, million units
Table 30. List of studied Russian manufacturers of medical devices (vials and ampoules)
Table 31. Dynamics and structure of the Russian production of medical products from glass tubes by manufacturers and types of products, 2020 – first half of 2022, tons, million rubles, million units
Table 32. Changes in the Russian manufacture of medical products from glass tubes by manufacturers and types of products, first half of 2021 / first half of 2022, tons, million rubles, million units
Table 33. Capacities and capacity utilization of Russian manufacturers of glass tube medical products
Table 34. Dynamics of average export prices for glass tube bottles by manufacturer and capacity, 2020 – first half of 2022, dollars per kg, cents per unit
Table 35. Dynamics of average export prices for glass tube bottles by capacity and manufacturers, 2020 – first half of 2022, cents per unit
Table 36. Dynamics of average export prices for ampoules by manufacturers and capacity, 2020 – first half of 2022, dollars per kg, cents per unit
Table 37. Dynamics of average export prices for ampoules by capacity and manufacturers, 2020 – first half of 2022, cents per unit
Table 38. Dynamics of average export prices for glass pipes, 2020 – first half of 2022, dollars per kg
Table 39. Dynamics and structure of Russian exports of glass medical products by product types, 2018 – first half of 2022, tons, thousand dollars, million units
Table 40. Dynamics and structure of Russian exports of medical products made of glass tubes by countries of destination, 2020 – first half of 2022, tons, thousand dollars, million units
Table 41. Dynamics and structure of Russian exports of glass tube medical products by product types and countries of destination, 2020 – first half of 2022, tons, thousand dollars, million units
Table 42. Dynamics and structure of Russian exports of glass tube medical products by manufacturers and types of products, 2020-2021, tons, thousand dollars, million units
Table 43. Dynamics and structure of the Russian market of glass medical devices by product types, 2018 – first half of 2022, tons, million rubles, million units
Table 44. Dynamics and structure of the Russian market of medical devices made of glass tubes by types of products and market parameters, 2020 – first half of 2022, tons, million rubles, million units
Table 45. The structure of the Russian market of medical devices made of glass tubes by key players, 2021, tons, million rubles, million units
Table 46. The current situation with the purchase of raw materials (glass pipes) by manufacturers
Table 47. Monthly dynamics and structure of Russian imports of glass pipes (raw materials) by importers and countries of origin, 2022, tons
Table 48. Dynamics and structure of Russian imports of medical products made of glass and raw materials (glass tubes) by color, 2020 – first half of 2022
Table 49. The structure of Russian imports of medical products made of glass tubes by recipients, types of products and main suppliers, 2021, tons, thousand dollars, million units
Table 50. The structure of Russian imports of glass tube bottles by main containers and manufacturers, 2020 – first half of 2022, tons, thousand dollars, million units (net transactions only)
Table 51. Structure of Russian imports of ampoules by main containers and manufacturers, 2020 – first half of 2022, tons, thousand dollars, million units (net transactions only)
Table 52. Structure of weighted average import prices for glass tube bottles by manufacturers, 2021 – first half of 2022, dollars per ton
Table 53. Structure of weighted average import prices for glass tube bottles by manufacturers and containers, 2020 – first half of 2022, dollars per ton
Table 54. Structure of weighted average import prices for ampoules and cartridges by manufacturers, 2021 – first half of 2022, dollars per ton
Table 55. Structure of weighted average import prices for glass tubes for the production of medical devices by manufacturers, 2021 – first half of 2022, dollars per ton
Table 56. Dynamics of average export prices for glass tube medical products by manufacturers, product types and capacity, 2020 – first half of 2022, dollars per kg, cents per unit
Diagram 1. Dynamics of Russian imports of glass tube medical products by product types, 2018 – first half of 2022 (actual), 2022 (estimation), thousand tons, million dollars
Diagram 2. Share distribution of Russian imports of glass tube medical products by country of origin, 2020 – first half of 2022, % (tons)
Diagram 3. Share distribution of Russian imports of glass pipes by countries of origin, 2020 – first half of 2022, % (tons)
Diagram 4. Dynamics of Russian production of medical products from glass tubes by product types, 2018 – first half of 2022 (actual), 2022 (estimation), thousand tons, million rubles
Diagram 5. Share distribution of Russian production of medical products from glass tubes by product types, 2021, % (tons), % (rubles), % (units)
Diagram 6. Share distribution of Russian production of medical products from glass tubes by manufacturers, 2021, % (tons)
Diagram 7. Share distribution of Russian exports of medical products from glass tubes by country of destination, 2021, % (tons), % (dollars), % (units)
Diagram 8. Dynamics of the Russian market of medical devices made of glass tubes by product types, 2018 – first half of 2022 (actual), 2022 (estimation), thousand tons, million rubles
Diagram 9. The share of imports in the Russian market of medical devices made of glass tubes by product type, 2021, % (tons), % (rubles), % (units)
Diagram 10. The share of exports from the Russian production of medical products from glass tubes by product type, 2021, % (tons), % (rubles), % (units)

