Specification
Summary
General product information
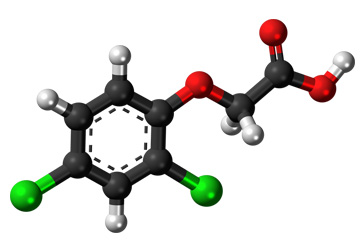
Formic acid
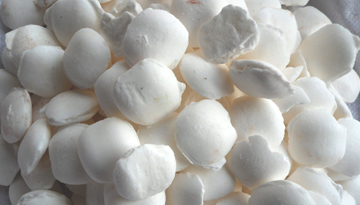
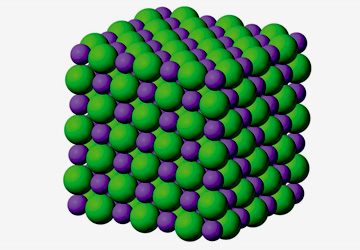
Formic acid salts (formates)
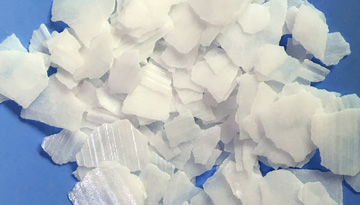
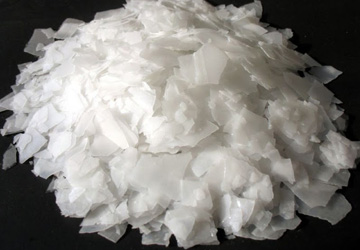
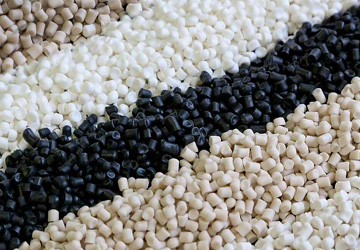
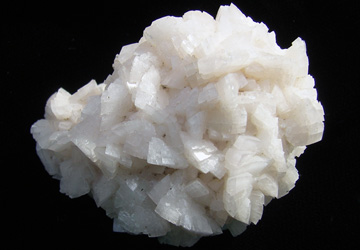
Sodium formate
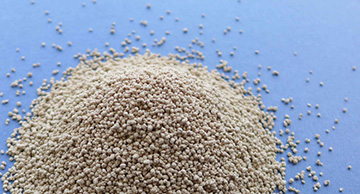
Calcium formate
Potassium formate
Other formates
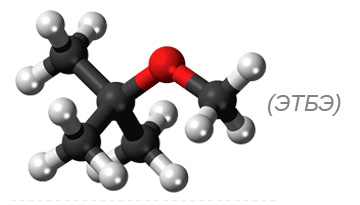
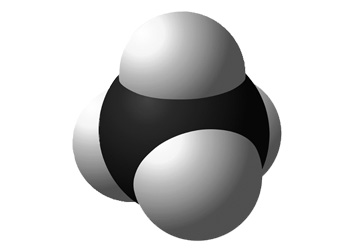
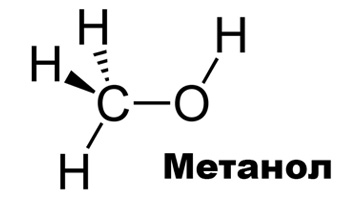
Methyl formate (ester of formic acid)
Product offering
Manufacturers and projects in the Russian Federation, CIS and USSR
Manufacturers and projects in the USSR
Current production in the Russian Federation
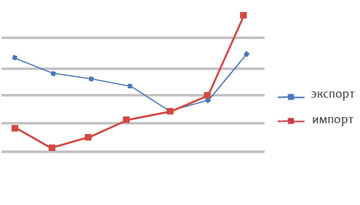
Import of products to the Russian Federation (suppliers, exporting countries, prices, volumes, main importers) for 2013-2022
Overall dynamics of imports
Dynamics of imports by manufacturers
Dynamics of formic acid imports by application and recipients
Dynamics of sodium formate imports by application and recipients
Dynamics of calcium formate imports by application and recipients
Dynamics of potassium formate imports by application and recipients
Dynamics and structure of imports of all Project Products by type of product and purpose
Export (including re-export) of products from the Russian Federation (volumes, prices, geography of deliveries)
Comparison of technical characteristics of products from different manufacturers present on the Russian market, differences in characteristics
Formic acid
Sodium formate
Potassium formate
Calcium formate
Ammonium formate
Methyl formate
Domestic consumption in the Russian Federation
Market volume and dynamics 2013-2022
Formic acid market
Sodium formate market
Other formates
Summary data for all products
Consumption segments
Deicing materials
Agrochemistry
Dry building mixes
Leather industry
Additives to drilling fluids
Trade
Consumption structure by segments
Consumption structure by product
Formic acid consumption structure
Sodium formate consumption structure
Calcium formate consumption structure
Potassium formate consumption structure
Consumers in the “Agrochemistry” segment
Forecast of consumption development until 2030
Main drivers of demand, forecast for the development of consumption segments
Forecast of consumption development until 2030
Prices in the Russian Federation
Dynamics of declared manufacturer/import prices (2013-2022)
Import price analysis
Manufacturer price analysis
Declared prices of the largest consumers (2013-2022)
Assessing the impact of logistics on the final price
Principles of pricing, price drivers, impact of price levels on consumption
Price forecast until 2030
Project products market in potential export directions (CIS countries, Turkey, India, China, Latin America)
Import dynamics of project products by country (tons, dollars)
Analysis of promising importing countries (input price levels, suppliers)
Brazil
Argentina
Turkey
India
Belarus
Investment projects to create new production facilities
Formic acid
Formates
Conclusions on the possibility of entering the market
Forecast volume of the Russian product market balance until 2030
Assessment of EuroChem's export prospects
Potential capacities for EuroChem, taking into account the forecast balance of the Russian market and export prospects
Appendices
Appendix 1. Technology of formic acid production at the Boreskov Institute of Catalysis of the Siberian Branch of the RAS
Appendix 2. Information on technologies for the production of calcium formate and potassium formate from formic acid
Appendix 3. Direct purchases of foreign-made project products over the past 5 years in selected segments
Segment “De-icing materials”
Segment "Agrochemistry"
Segment “Dry building mixes”
Segment “Leather industry”
Segment “Trade”
LIST OF TABLES AND DIAGRAMS
Table 1. Positive and negative factors for creating a new production of Project Products in Russia
Table 2. Patents for the production of formic acid from manufacturers
Table 3. Areas of application of formic acid in Russia and in the world
Table 4. The world's largest manufacturers of sodium formate, production technologies
Table 5. Patents for the production of calcium formate from manufacturers
Table 6. Methods of obtaining potassium formate
Table 7. Technologies for the production of formic acid in the USSR and the Russian Federation
Table 8. Patents for the production of sodium formates by Russian companies
Table 9. Closed production facilities and unrealized projects for the production of formic acid and formates in Russia / USSR
Table 10. Manufacturers of formic acid and formates in the Russian Federation, CIS, USSR
Table 11. Dynamics of sodium formate production by PJSC Metafrax, 2013-2022, thousand tons, million rubles
Table 12. Consumers of sodium formate produced by Metafrax, tons
Table 13. Import volume by code, share of researched products, 2013-2022, tons
Table 14. Dynamics and structure of import of Project Products by product type, 2013-2022, tons
Table 15. Dynamics and structure of import of Project Products by product type, 2013-2022, thousand dollars
Table 16. Dynamics and structure of import of Project Products by main countries and types of products, 2013-2022, tons, thousand dollars
Table 17. Dynamics and structure of import of Project Products by type of product and main countries, 2013-2022, tons, price in dollars per ton
Table 18. Dynamics and structure of import of Project Products by main manufacturers, 2013-2022, tons, price in dollars per ton
Table 19. Dynamics and structure of import of Project Products by type of product and main manufacturers, 2013-2022, tons, price in dollars per ton
Table 20. Volume of formic acid imports by type of recipient, 2013-2022, tons
Table 21. Volume of formic acid imports by destination, 2013-2022, tons
Table 22. Volume of formic acid imports by top 20 main recipients in total for all years, 2013-2022, tons
Table 23. Volume of formic acid imports by top 20 main recipients for 2022, tons
Table 24. Volume of formic acid imports by final recipients who increased their purchase volume in 2022
Table 25. Import volume of sodium formate by type of recipient, 2013-2022, tons
Table 26. Import volume of sodium formate by destination, 2013-2022, tons
Table 27. Volume of sodium formate imports by top 20 main recipients in total for all years, 2013-2022, tons
Table 28. Import volume of sodium formate by top 20 main recipients for 2022, tons
Table 29. Import volume of sodium formate by final recipients who increased their purchase volume in 2022
Table 30. Dynamics of calcium formate imports by type of recipient, 2013-2022, tons
Table 31. Import volume of calcium formate by destination, 2013-2022, tons
Table 32. Volume of calcium formate imports by top 20 main recipients in total for all years, 2013-2022, tons
Table 33. Import volume of calcium formate by top 15 main recipients for 2022, tons
Table 34. Import volume of calcium formate by end recipients for 2013-2022, tons
Table 35. Dynamics of potassium formate imports by type of recipient, 2013-2022, tons
Table 36. Import volume of potassium formate by destination, 2013-2022, tons
Table 37. Import volume of potassium formate by recipient for 2013-2022, tons
Table 38. Import volume of potassium formate by end recipients for 2013-2022, tons
Table 39. Dynamics and structure of import of Project Products by product type and purpose, 2013-2022, tons, price in dollars per ton
Table 40. Project products by product type and purpose, 2013-2022, tons
Table 41. Dynamics and structure of import of Project Products by final recipients and products for all years, 2013-2022, tons
Table 42. Dynamics and structure of exports (including re-exports) of formates to all countries, including EAEU, 2013-2022, tons
Table 43. Comparison of technical characteristics of products from the main manufacturers of formic acid in the Russian market
Table 44. Areas of application of formic acid from the main manufacturers in the Russian market
Table 45. Comparison of technical characteristics of products from the main manufacturers of sodium formate in the Russian market
Table 46. Areas of application of sodium formate from the main manufacturers in the Russian market
Table 47. Comparison of technical characteristics of products from the main manufacturers of potassium formate in the Russian market
Table 48. Areas of application of potassium formate from the main manufacturers in the Russian market
Table 49. Comparison of technical characteristics of the main manufacturers of calcium formate in the Russian market
Table 50. Areas of application of calcium formate from the main manufacturers in the Russian market
Table 51. Comparison of technical characteristics of the main manufacturers of ammonium formate in the Russian market
Table 52. Comparison of technical characteristics of the main manufacturers of ammonium formate in the Russian market
Table 53. Dynamics of the Russian formic acid market, 2013-2022, tons, million rubles
Table 54. Dynamics of the Russian sodium formate market, 2013-2022, tons
Table 55. Dynamics of the Russian sodium formate market, 2013-2022, million rubles (including duties and VAT)
Table 56. Dynamics of the Russian market for other formates, 2013-2022, tons
Table 57. Dynamics of the Russian market for other formates, 2013-2022, million rubles (including duties and VAT)
Table 58. Dynamics and structure of the Russian market for Project Products by product type, 2013-2022, tons
Table 59. Prices for Project Products by product type, 2013-2022, thousand rubles per ton (with VAT)
Table 60. Dynamics and structure of the Russian market for Project Products by product type, 2013-2022, million rubles (including duties and VAT)
Table 61. Consumers of Project Products in the Deicing Materials segment, specialization, revenue in million rubles
Table 62. Consumers of Project Products in the Deicing Materials segment
Table 63. Studied consumers of Project Products in the Agrochemicals segment, specialization, revenue in million rubles
Table 64. Consumers of Project Products in the Agrochemicals segment
Table 65. Consumers of Project Products in the Dry Construction Mixtures segment, revenue in million rubles
Table 66. Consumers of Project Products in the Dry Construction Mixtures segment
Table 67. Consumers of Project Products in the Leather Industry segment, revenue in million rubles
Table 68. Consumers of Project Products in the Leather Industry segment
Table 69. Dynamics of product consumption over the past 5 years by the main consumers in the Additives to Drilling Fluids segment
Table 70. Consumers of Project Products in the Drilling Fluids segment
Table 71. Trading companies purchasing Project Products
Table 72. Structure of consumption of Project Products by segment, 2022, tons
Table 73. Identified end users of formic acid in all segments
Table 74. Assessment of the structure of formic acid consumption by segment
Table 75. Identified end users of sodium formate
Table 76. Structure of sodium formate consumption by segments
Table 77. Identified consumers of calcium formate
Table 78. Structure of calcium formate consumption by segments
Table 79. Identified consumers of potassium formate
Table 80. Structure of potassium formate consumption by segment, tons, %
Table 81. Identified consumers in the Agrochemicals segment
Table 82. Import of feed additives and preservatives for the production of feed based on formic acid and formates, 2017-2022, tons, thousand dollars
Table 83. Forecast of demand for Project Products by segment
Table 84. Forecast of demand for Project Products by segment, 2022-2030, tons
Table 85. Forecast of demand for Project Products, forecast of changes in the share in the total market volume, 2022/2030, tons
Table 86. Forecast of the Russian market for Project Products by type, 2022-2030, tons
Table 87. Forecast of the Russian market for Project Products by type, 2022-2030, million rubles
Table 88. Forecast of the Russian market for Project Products by type, 2022-2030, million dollars
Table 89. Import prices by product and manufacturer, 2013-2022, dollars per ton
Table 90. Import prices by product and manufacturer, 2013-2022, thousand rubles per ton (with duties and VAT)
Table 91. Prices by foreign manufacturers, dollars per ton, 2013-2022
Table 92. Prices for sodium formate by manufacturer, 2013-2022, thousand rubles per ton
Table 93. Import prices by consumer, product, the Deicing Materials segment, 2013-2022, thousand rubles per ton (with duties and VAT)
Table 94. Import prices by consumer, product, the Agrochemicals segment, 2013-2022, thousand rubles per ton (with duties and VAT)
Table 95. Import prices by consumer, product, the Dry Construction Mixtures segment, 2013-2022, thousand rubles per ton (with duties and VAT)
Table 96. Import prices by consumer, product, the Leather Industry segment, 2013-2022, thousand rubles per ton (with duties and VAT)
Table 97. Import prices by consumer, product, the Other Industries / Trade segment, 2013-2022, thousand rubles per ton (with duties and VAT)
Table 98. Calculation of costs for delivery of sodium formate to key consumers when delivered via Vladivostok
Table 99. Changes in prices for products of the Foreign Production Project, 2021/2013, 2022/2021, dollars per ton
Table 100. Prices for foreign-made Project Products, dollars per ton, 2013-2022
Table 101. Changes in the volume of the Russian market for Project Products and price levels, 2013-2022
Table 102. Forecast of prices for Project Products at the “entrance to the Russian market”, 2013-2022, dollars per ton
Table 103. Price forecast for Project Products, 2013-2022, thousand rubles per ton (with duties and VAT)
Table 104. Dynamics and structure of import of Project Products by studied recipient regions and products, 2017-2021, thousand tons
Table 105. Dynamics and structure of import of Project Products by studied recipient regions and products, 2017-2021, million dollars
Table 106. Dynamics and structure of imports of all Project Products into the studied countries, by recipient countries, 2017-2022, thousand tons
Table 107. Dynamics and structure of imports of all Project Products into the studied countries, by recipient countries, 2017-2022, million dollars
Table 108. Structure of import of Project Products to Brazil by supplier countries, 2017-2022, thousand tons, dollars per ton
Table 109. Structure of import of Project Products to Argentina by supplier countries, 2017-2021, thousand tons, dollars per ton
Table 110. Structure of import of Project Products to Turkey by supplier countries, 2017-2022, thousand tons, dollars per ton
Table 111. Structure of import of Project Products to India by supplier countries, 2017-2021, thousand tons, dollars per ton
Table 112. Structure of import of Project Products to Belarus by supplier countries, 2017-2021, thousand tons, dollars per ton
Table 113. Structure of global formic acid production capacity by manufacturer, thousand tons per year
Table 114. The world's largest manufacturers of formates
Table 115. Market balance forecast by product, tons, 2022-2030
Table 116. Action plan for import substitution in the Russian chemical industry regarding the supply of formic acid and formates
Table 117. Positive and negative factors for creating a new production of Project Products in Russia
Table 118. Potential capacities for EuroChem, considering the forecast balance of the Russian market in 2030 and export prospects
Table 119. Characteristics of reactors and loading of catalysts
Table 120. Methanol oxidation. MS reactor
Table 121. Formaldehyde oxidation. Reactor 1
Table 122. Formaldehyde oxidation. Reactor 2
Table 123. Total oxidation of formaldehyde in reactors 1 and 2
Table 124. Results of the hourly balance experiment
Table 125. Indicators of the process of obtaining formic acid under optimal conditions
Table 126. Patents for the production of calcium formate from manufacturers
Table 127. Patents for the production of potassium formate
Table 128. Direct purchases of foreign-made Project Products over the past 5 years in the Deicing Materials segment
Table 129. Direct purchases of foreign-made Project Products over the past 5 years in the Agrochemicals segment
Table 130. Direct purchases of foreign-made Project Products over the past 5 years in the Dry Construction Mixtures segment
Table 131. Direct purchases of foreign-made Project Products over the past 5 years in the Leather Industry segment
Table 132. Direct purchases of foreign-made Project Products over the past 5 years in the Trade segment
Diagram 1. Structure of the Russian sodium formate market by product origin, 2013-2022, thousand tons, % (tons)
Diagram 2. Structure of the Russian formate market by type, 2022, thousand tons, thousand dollars, %
Diagram 3. Consumption structure of Project Products by segments, 2022, thousand tons, %
Diagram 4. Forecast of demand for Project Products by segment, 2022-2030, thousand tons
Diagram 5. Average annual growth rate in the Project Products markets, 2022-2030, %
Diagram 6. Forecast of changes in the share of Project Products in the total volume of the Russian market, 2022/2030, thousand tons, %
Diagram 7. Forecast of the Russian market for Project Products by type, 2022-2030, thousand tons
Diagram 8. Forecast of the Russian market for Project Products by type, 2022-2030, million rubles
Diagram 9. Dynamics of average import prices by product, 2013-2022, dollars per ton
Diagram 10. Changes in the volume of the Russian market for Project Products and price levels, 2013-2022
Diagram 11. Structure of import of Project Products to Brazil by supplier country, 2022, thousand tons, % (tons)
Diagram 12. Structure of import of Project Products to Argentina by supplier country, 2021, thousand tons, % (tons)
Diagram 13. Structure of import of Project Products to Turkey by supplier country, 2022, thousand tons, % (tons)
Diagram 14. Structure of import of Project Products to India by supplier country, 2021, thousand tons, % (tons)
Diagram 15. Structure of import of Project Products to Belarus by supplier country, 2021, thousand tons, % (tons)
File name: API-2161