Specification
Summary
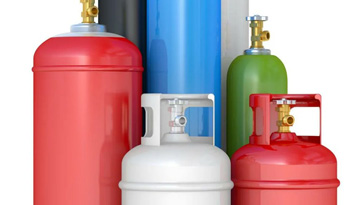
General product information
World UAN market
Current trends in the global UAN market
Total volume, dynamics, structure and trends of world UAN production
Total volume, dynamics, structure and trends of world UAN consumption
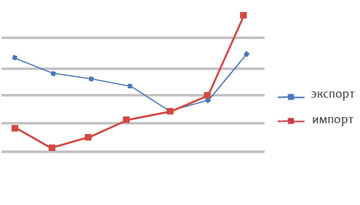
The structure of the world UAN trade
Dynamics of the world trade of UAN, urea, ammonium nitrate
Main exporting countries of UAN
Main importing countries of UAN
The main UAN importers among the sanction-free countries
Import duties on UAN
Structure of world prices for UAN and substitute goods
Dynamics and structure of world prices for UAN, 2017-2022
Price level for UAN when imported into sanction-free countries
Price level for substitute goods when imported into sanction-free countries
Price level for UAN when exported from net exporting countries
Identification of price dependence between UAN and substitute goods
UAN price forecast until 2027
Forecast of the world market development
Factors affecting the UAN market
Forecast of production by main producing and exporting countries
Forecast of possible changes in the structure of UAN supplies by key consumer countries
Forecast of production and consumption of UAN in the world until 2027
Russian UAN market
Dynamics of Russian production of UAN, structure by manufacturers
Dynamics of the Russian UAN market, balance of supply and demand
Current trends in the Russian UAN market
Dynamics and forecast of Russian prices for UAN until 2027
Forecast of the development of the Russian market
Planned introduction of capacities for the production of UAN until 2027
Forecast of production and consumption of UAN in Russia until 2027
UAN market of the CIS countries
The size of the UAN market of the CIS countries, assessment of the influence of their producers
UAN production in the CIS countries
Consumption of UAN in the CIS countries
Forecast of possible changes in the supply structure until 2027
Plans for commissioning capacities for the production of UAN in the CIS countries
Forecast of possible changes in the structure of deliveries in the context of the CIS countries
Transport infrastructure, transportation cost
Characteristics of the transport infrastructure for export from the Russian Federation: the presence of terminals for transshipment in ports or at the border
Cost of transportation to main export markets
Appendices
Appendix 1. Dynamics of quarterly world prices for UAN, substitute goods and natural gas
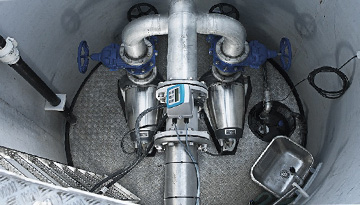
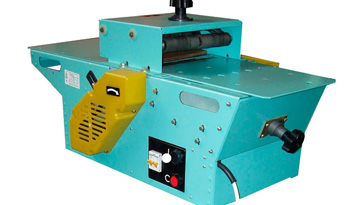
Appendix 2. Reference list of LLC PK Tekhmash (TM Nagro) for the supply of mortar units for the preparation of UAN
LIST OF TABLES AND DIAGRAMS
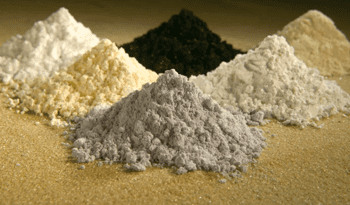
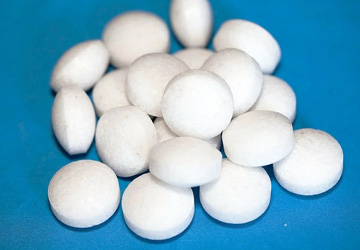
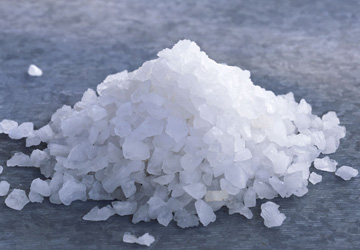
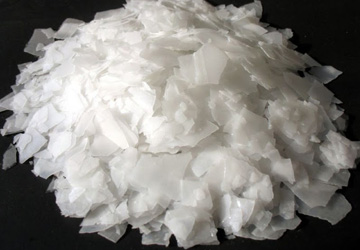
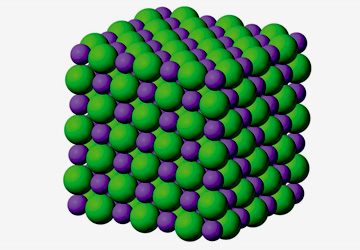
Table 1. The main types of nitrogen fertilizers
Table 2. Content of the main active substance
Table 3. Advantages and disadvantages of UAN
Table 4. Dynamics and structure of world production and capacities of UAN by regions; capacity utilization, 2017-2021, million tons
Table 5. Dynamics and structure of world UAN production by regions and countries, 2017-2021, thousand tons
Table 6. Dynamics and structure of world UAN production by manufacturers, 2017-2021, thousand tons
Table 7. Dynamics and structure of the world market (consumption) of UAN by regions, 2017-2021, thousand tons
Table 8. The balance of supply and demand in the global UAN market by region, 2021, million tons
Table 9. The balance of supply and demand in the global UAN market by leading consumer countries, 2021, thousand tons
Table 10. Dynamics of world trade of UAN, urea, ammonium nitrate, 2017-2021, thousand tons
Table 11. Main UAN exporting countries, 2017-2021, thousand tons, million dollars
Table 12. Structure of exports of the main UAN exporting countries by countries of destination, 2017-2021, thousand tons
Table 13. Main net exporting countries of UAN, 2017-2021, thousand tons
Table 14. Main UAN importing countries, 2017-2021, thousand tons, million dollars
Table 15. The structure of imports of the main importing countries of UAN by countries of origin, 2017-2021, thousand tons, %
Table 16. Main net importing countries of UAN, 2017-2021, thousand tons
Table 17. Major friendly importing countries of UAN, 2017-2021
Table 18. The volume of UAN imports of friendly countries, 2017-2021, thousand tons
Table 19. The main supplying countries of UAN to friendly countries, 2021, thousand tons
Table 20. Import duties on nitrogen fertilizers, including UAN for deliveries to Europe
Table 21. Import duties on UAN for deliveries to the USA
Table 22. Dynamics of world prices for UAN, 2017-Q1 2022, dollars per ton
Table 23. Dynamics of average import prices for UAN by main importing countries, 2017-2021, dollars per ton
Table 24. Dynamics of average import prices for carbamide by main importing countries, 2017-2021, dollars per ton
Table 25. Dynamics of average import prices for ammonium nitrate by main importing countries, 2017-2021, dollars per ton
Table 26. Dynamics of average export prices for UAN by main exporting countries, 2017-2021, dollars per ton
Table 27. Dynamics of world prices for UAN, urea, ammonium nitrate, ammonia, 2017-Q1 2022, dollars per ton
Table 28. Selling price dynamics for UAN, urea, ammonium nitrate, ammonia from CF Industries (the world's largest producer), 2017-2021, dollars per ton
Table 29. Natural gas price forecast by the world's leading agencies, 2022-2027, dollars per MMBTU
Table 30. Dynamics and structure of world UAN production by regions and countries, 2017-2021, thousand tons
Table 31. Forecast of the structure of world trade of UAN by main exporting countries, 2021-2027
Table 32. Conditions of consumption of nitrogen fertilizers (including UAN) by main consumer countries, 2021, thousand tons
Table 33. Dynamics of UAN consumption and imports of nitrogen fertilizers in the USA, 2017-2021, thousand tons
Table 34. Dynamics of UAN imports in the USA by supplying countries, 2017-2021, thousand tons
Table 35. Urea import dynamics in the USA by supplying countries, 2017-2017, thousand tons
Table 36. Dynamics of imports of ammonium nitrate in the USA by supplying countries, 2017-2021, thousand tons
Table 37. Dynamics of UAN consumption and nitrogen fertilizer Imports in France, 2017-2021, thousand tons
Table 38. Dynamics of UAN imports in France by supplying countries, 2017-2021, thousand tons
Table 39. Urea import dynamics in France by supplying countries, 2017-2021, thousand tons
Table 40. Dynamics of UAN consumption and imports of nitrogen fertilizers in Australia, 2017-2021, thousand tons
Table 41. Dynamics of UAN imports in Australia by supplying countries, 2017-2021, thousand tons
Table 42. Urea import dynamics in Australia by supplying countries, 2017-2021, thousand tons
Table 43. Dynamics of UAN consumption and imports of nitrogen fertilizers in Argentina, 2017-2021, thousand tons
Table 44. Dynamics of UAN imports in Argentina by supplying countries, 2017-2021, thousand tons
Table 45. Urea import dynamics in Argentina by supplying countries, 2017-2021, thousand tons
Table 46. Dynamics and structure of fertilizer consumption in Germany by type, 2017-2021, thousand tons
Table 47. Dynamics of UAN consumption and imports of nitrogen fertilizers in Germany, 2017-2021, thousand tons
Table 48. Dynamics of UAN imports in Germany by supplying countries, 2017-2021, thousand tons
Table 49. Urea import dynamics in Germany by supplying countries, 2017-2021, thousand tons
Table 50. Dynamics of UAN consumption and imports of nitrogen fertilizers in the UK, 2017-2021, thousand tons
Table 51. Dynamics of UAN imports in the UK by supplying countries, 2017-2021, thousand tons
Table 52. Urea import dynamics in the UK by supplying countries, 2017-2021, thousand tons
Table 53. Dynamics of imports of ammonium nitrate in the UK by supplying countries, 2017-2021, thousand tons
Table 54. Dynamics of UAN consumption and imports of nitrogen fertilizers in Spain, 2017-2021, thousand tons
Table 55. Dynamics of UAN imports in Spain by supplying countries, 2017-2021, thousand tons
Table 56. Urea import dynamics in Spain by supplying countries, 2017-2021, thousand tons
Table 57. Dynamics of fertilizer consumption in Hungary by type, 2017-2021, thousand tons
Table 58. Dynamics of UAN consumption and imports of nitrogen fertilizers in Hungary, 2017-2021, thousand tons
Table 59. Dynamics of UAN imports in Hungary by supplying countries, 2017-2021, thousand tons
Table 60. Urea import dynamics in Hungary by supplying countries, 2017-2021, thousand tons
Table 61. Dynamics of imports of ammonium nitrate in Hungary by supplying countries, 2017-2021, thousand tons
Table 62. Dynamics of UAN consumption and imports of nitrogen fertilizers in Brazil, 2017-2021, thousand tons
Table 63. Dynamics of UAN imports in Brazil by supplying countries, 2017-2021, thousand tons
Table 64. Urea import dynamics in Brazil by supplying countries, 2017-2021, thousand tons
Table 65. Dynamics of imports of ammonium nitrate in Brazil by supplying countries, 2017-2021, thousand tons
Table 66. Dynamics of UAN consumption and imports of nitrogen fertilizers in Mexico, 2017-2021, thousand tons
Table 67. Dynamics of UAN imports in Mexico by supplying countries, 2017-2021, thousand tons
Table 68. Urea import dynamics in Mexico by supplying countries, 2017-2021, thousand tons
Table 69. Dynamics of imports of ammonium nitrate in Mexico by supplying countries, 2017-2021, thousand tons
Table 70. UAN import forecast by importing countries, 2022-2027, thousand tons
Table 71. Forecast of the global UAN market and global UAN trade, 2022-2027, thousand tons
Table 72. Dynamics and structure of Russian UAN production by manufacturers; capacity utilization, 2017-2021, thousand tons
Table 73. Dynamics of the Russian market of UAN and substitute products (urea, ammonium nitrate), 2017-2021, thousand tons
Table 74. Structure of UAN deliveries from Russian manufacturers, 2017-2021, thousand tons
Table 75. Dynamics and structure of production of UAN, urea, ammonium nitrate in the Russian Federation, 2017-2021, thousand tons
Table 76. Dynamics and structure of consumption of UAN, carbamide, ammonium nitrate in the Russian Federation, 2017-2021, thousand tons
Table 77. The share of exports of UAN, urea, ammonium nitrate from production volume, 2017-2021, % of thousand tons
Table 78. Dynamics of UAN prices for deliveries to domestic and foreign markets, price level for natural gas, 2017-2021
Table 79. Dynamics of producer prices for UAN, urea, ammonium nitrate when supplied to the domestic market, quarterly, 2022, rubles per ton without VAT, ex works
Table 80. Forecast of UAN prices for supplies to the domestic market, 2021-2027, rubles per ton without VAT
Table 81. Dynamics of Russian export prices for UAN by manufacturers, dollars per ton without VAT, at the border of the Russian Federation, 2017 - January-May 2022
Table 82. Plans of current UAN manufacturers
Table 83. UAN, urea and ammonia capacity increments in Russia (based on current announced projects)
Table 84. Plans for the introduction of new capacities of UAN, urea and ammonia in Russia
Table 85. Plans for the purchase of mineral fertilizers until 2025 according to the Ministry of Agriculture of the Russian Federation, thousand tons (in terms of active ingredient)
Table 86. Dynamics and structure of Russian production of UAN by types of fertilizers, 2017-2021, thousand tons
Table 87. Dynamics and structure of Russian consumption of UAN by types of fertilizers, 2017-2021, thousand tons
Table 88. Forecast of Russian production and consumption of UAN, 2022-2027, thousand tons
Table 89. Availability of industrial production of nitrogen fertilizers (including UAN) in the CIS countries
Table 90. Dynamics and structure of UAN production in the CIS countries (without the Russian Federation) by manufacturers, 2017-2021, thousand tons
Table 91. Dynamics and structure of the UAN market in the CIS countries (excluding the Russian Federation) by countries, 2017-2021, thousand tons
Table 92. UAN imports in the CIS by countries, 2012-2021, thousand tons
Table 93. UAN exports from the CIS by countries, 2012-2021, thousand tons
Table 94. Current capacities for the production of urea, ammonium nitrate, UAN in the CIS by countries and manufacturers, 2021, thousand tons
Table 95. Plans for commissioning new capacities for the production of urea, ammonium nitrate, UAN in the CIS, 2022-2027, thousand tons
Table 96. Plans for commissioning new capacities for the production of urea, ammonium nitrate, UAN in the CIS by countries, 2021/ 2027, thousand tons
Table 97. Plans for commissioning new capacities for the production of urea, ammonium nitrate, UAN in Belarus and Ukraine
Table 98. Plans for commissioning new facilities for the production of urea, ammonium nitrate, UAN in Uzbekistan
Table 99. Plans to commission new capacities for the production of urea, ammonium nitrate, UAN in other CIS countries
Table 100. Parameters of the market of nitrogen fertilizers in the CIS countries
Table 101. Dynamics of imports of nitrogen fertilizers (urea, ammonium nitrate, UAN) to the Republic of Moldova, 2017-2021, thousand tons
Table 102. Forecast of UAN market in the CIS countries, 2021-2027, thousand tons
Table 103. The main terminals for the export of Russian liquid fertilizers
Table 104. UAN export structure by shippers and ports, 2017-2021
Table 105. Characteristics of UAN transshipment terminals
Table 106. Distance to the main border stations for export deliveries
Table 107. The cost of transporting UAN to the main export markets
Table 108. The reference list for Russia
Table 109. The reference list for Kazakhstan
Diagram 1. Dynamics and structure of world UAN production by regions, 2017-2021, million tons
Diagram 2. Dynamics and structure of world consumption of nitrogen fertilizers (UAN, urea, ammonium nitrate) by product type, 2017-2021, million tons
Diagram 3. Dynamics and structure of the global UAN consumption market by region, 2017-2021, million tons
Diagram 4. Structure of world trade of UAN, urea, ammonium nitrate, 2017-2021, million tons
Diagram 5. Dynamics of world trade of UAN, including the share of Russia, 2017-2021, million tons
Diagram 6. Dynamics of world prices for UAN, 2017 – Q1 2022, dollars per ton
Diagram 7. Dynamics of average import prices for UAN of the leading importing countries (friendly and unfriendly), 2017-2021, dollars per ton
Diagram 8. Dynamics of average export prices for UAN of the leading exporting countries, 2017-2021, dollars per ton
Diagram 9. Dependence of world prices for UAN, urea, ammonium nitrate, ammonia, natural gas (Henry Hub), 2017 – 1Q 2022, dollars per ton
Diagram 10. Dependence of world prices for UAN, urea, ammonium nitrate, ammonia, natural gas (TTF Europe), 2017 – 1Q 2022, dollars per ton
Diagram 11. Dynamics of selling prices for UAN, urea, ammonium nitrate, ammonia CF, 2017-2021, dollars per ton
Diagram 12. Forecast of world prices for UAN, 2022-2027, dollars per ton
Diagram 13. Forecast of the global market and global trade of UAN, 2021-2027, million tons
Diagram 14. Dynamics of Russian production of UAN, 2017-2021, thousand tons
Diagram 15. Dynamics of the Russian market of UAN and substitute products, 2017-2021, thousand tons
Diagram 16. Dynamics and structure of the Russian production of UAN in the context of supply lines, 2017-2021, thousand tons
Diagram 17. Balance of supply and demand in the Russian UAN market, 2017-2021, thousand tons
Diagram 18. Price level for UAN in the domestic market by producers, 2022 (full year, evaluation), thousand rubles per ton without VAT, ex works
Diagram 19. Forecast of Russian production and consumption of UAN, 2022-2027, thousand tons
Diagram 20. Dynamics and structure of UAN production in the CIS countries (excluding Russia), 2017-2021, thousand tons, %
Diagram 21. Dynamics and structure of the UAN market in the CIS countries (without the Russian Federation), 2017-2021, thousand tons
Diagram 22. UAN supply and demand balance in the CIS countries (excluding Russia), 2017-2021, thousand tons
Diagram 23. Dynamics of world quarterly prices for UAN, urea, ammonia and natural gas, 2017 – 1Q 2022, dollars per ton, dollars per million BTU
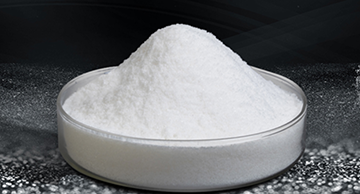
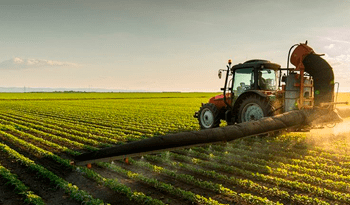
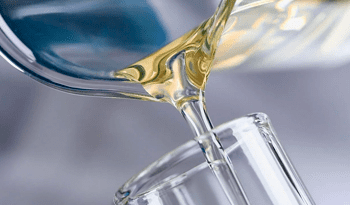
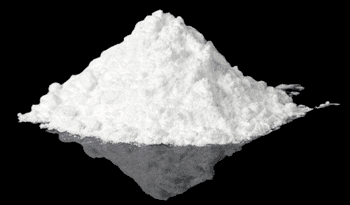
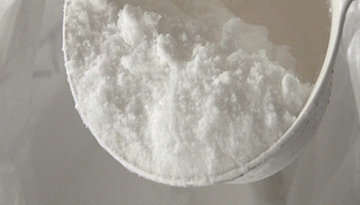
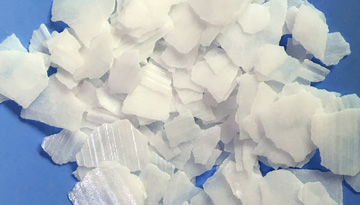
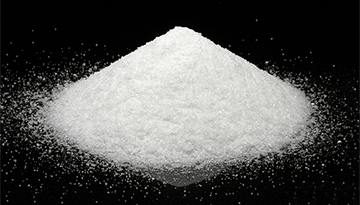
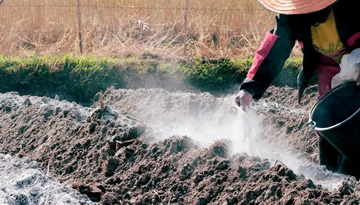
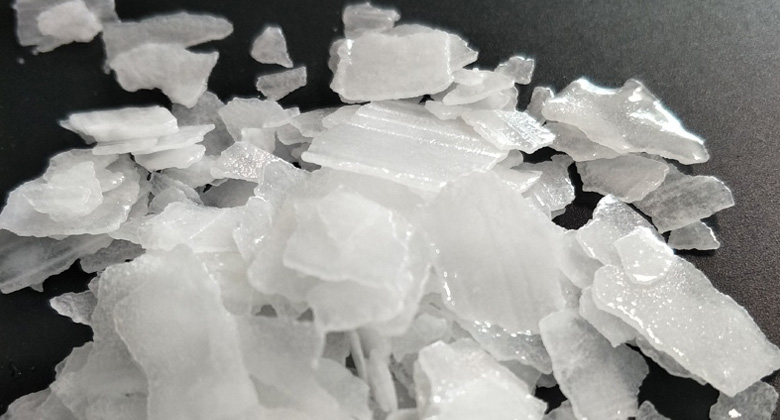
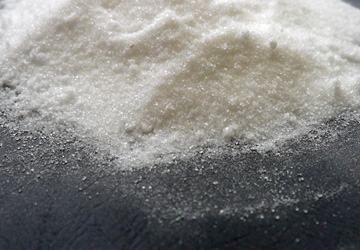
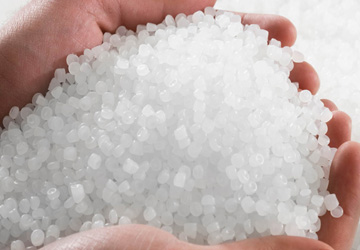
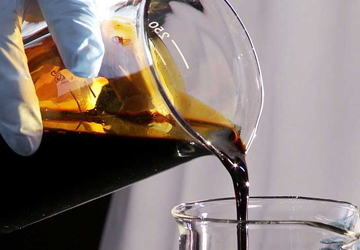
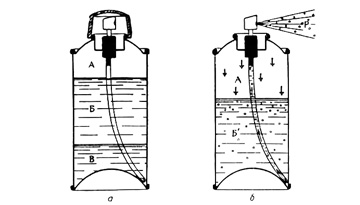
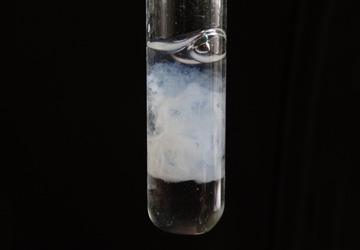
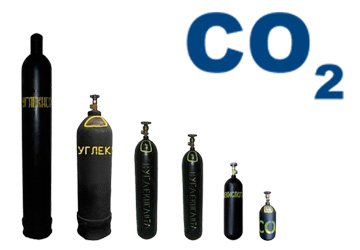
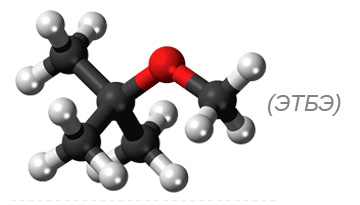
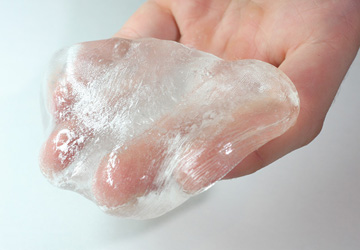
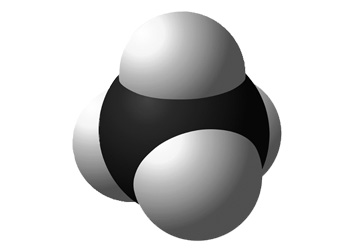
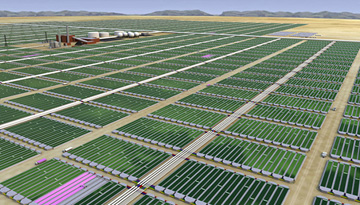
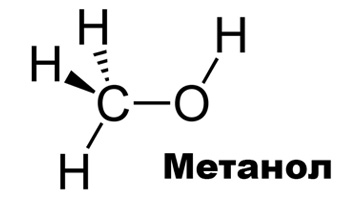
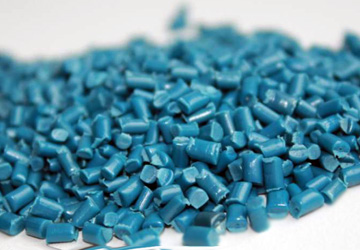
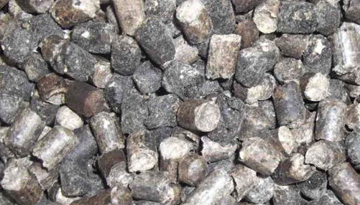
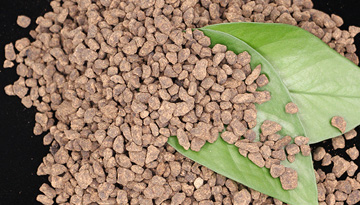
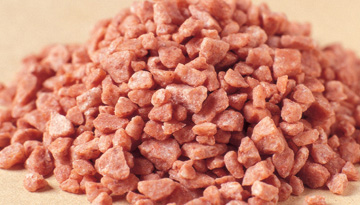
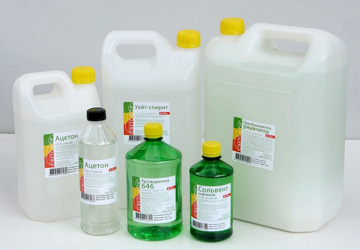
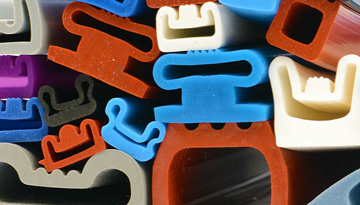
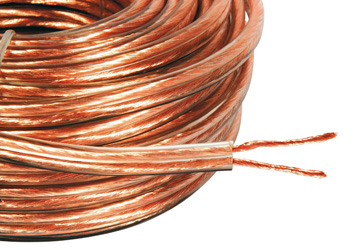
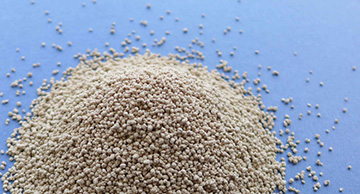
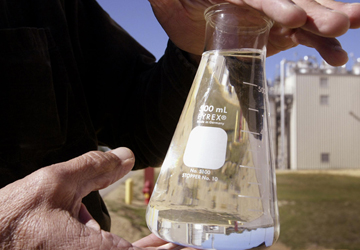
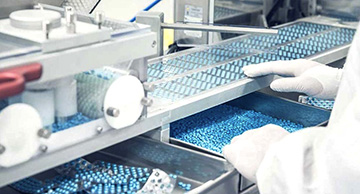
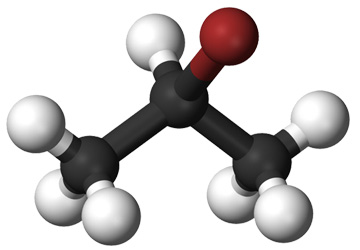
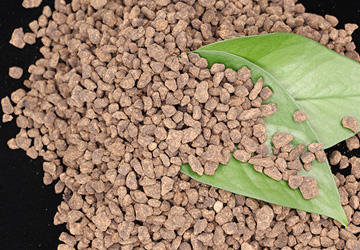
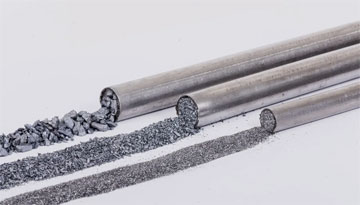
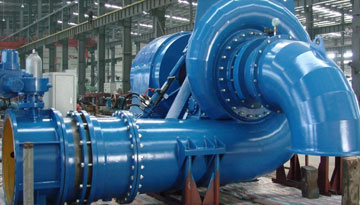
Urea-ammonia mixture is the only nitrogen fertilizer containing three forms of nitrogen - nitrate, ammonium and amide. The combination of three forms of nitrogen allows for prolonged plant nutrition and complete nitrogen uptake. The presence of nitrogen in the amide form in the UAN composition allows the fertilizer to be used also for foliar top dressing.
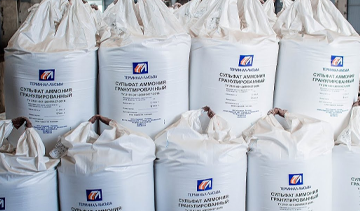
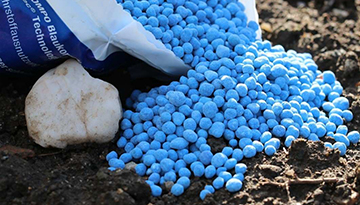
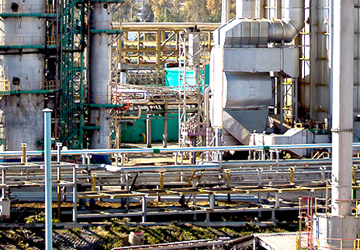
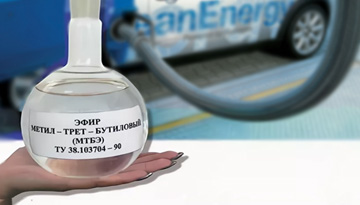
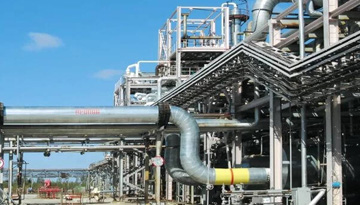
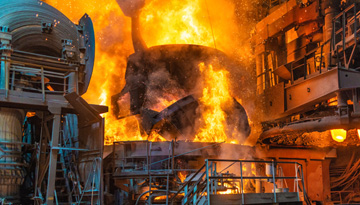
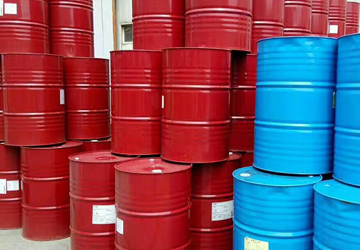
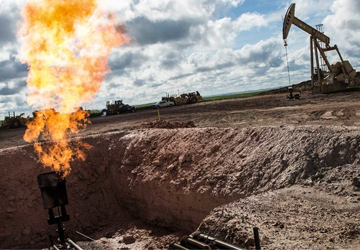
The increase in the cost of natural gas and ammonia on the world market in 2022 led to a multiple increase in prices for the urea-ammonia mixture. Taking into account the competitive advantages of Russia, the production of urea-ammonia mixture has become a very attractive business.
File name: API-2113