Summary
I. Subject
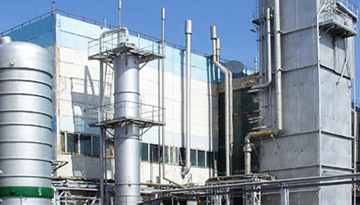
1. General information
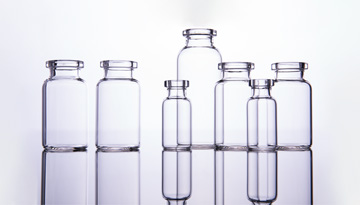
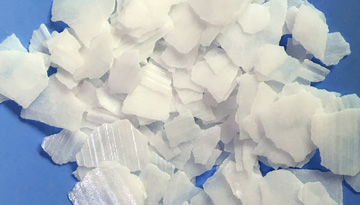
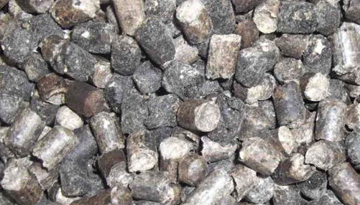
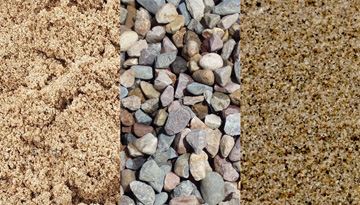
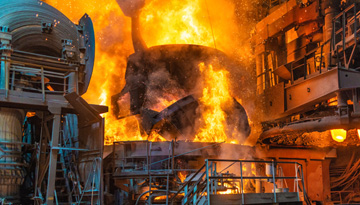
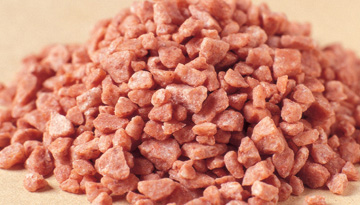
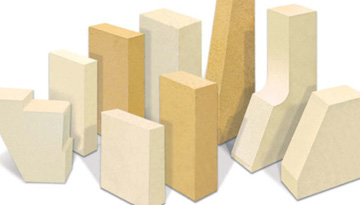
Raw materials used for production
General statistics of the glass market
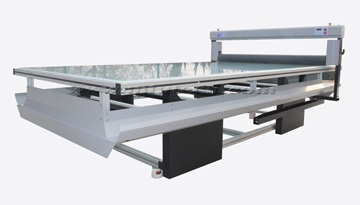
2. Characteristics of large glass manufacturers in the Russian federation, investment projects
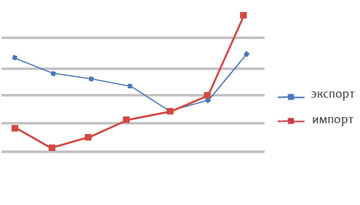
3. Import of glass in the Russian federation
General import statistics
Price situation (import)
Countries supplying glassware to Russia by import
Russian importers glasses
4. Export of glassware from Russia
General export statistics
Countries consuming glassware exported from Russia
Pricing environment (export)
Exporters of glassware from the Russian federation and their clients
5. Estimation of the volume of glassware consumption in the Russian federation (market capacity)
II. Demand for glass in the Russian federation
Production of alcoholic beverages in the Russian federation
Beer production
Vodka and alcoholic beverages
Wine, champagne
Production of canned products
III. Financial indicators by industry: production of glassware, okved code 26.13 - manufacture of hollow glassware
Appendix 1
1. Ruscam company
2. Rasko
3. Russteklo
4. TD LLC "KSE"
5. LLC “Chagodoschensky glass factory and k”
6. JSK “Alexin glass”
7. "Stekol'naya proizvodstvennaya gruppa" group
8. Saint-gobain concern
LIST OF TABLES AND DIAGRAMS
Table 1. Summary table - glassware market statistics, 2009-2010 - in natural calculation
Table 2. Capacity of glass production enterprises, million
Table 3. Consolidated table. Volumes of import and average prices for types of imported glass in 2006 - 2009
Table 4. Importers of glassware with segmentation by category of goods, according to the FCC for 9 months of 2010
Table 5. Export volumes and average prices by types of glassware in 2007- 9 months of 2010 gg.
Table 6. Consumers of Russian glassware, 2009
Table 7. Importers of products by “Stekol'naya proizvodstvennaya gruppa" group
9 months of 2010
Table 8. Revenue (net) from sales, costs, profit, profitability of sales
Figure 1. Share of import and export of glassware
Figure 2. Dynamics and forecast of consumption of glassware (net) in the Russian federation
Figure 3. Structure of glassware consumption by product
Figure 4. Ratio of production volumes of glass bottles and glass cans in the Russian federation, 2009-2010
Figure 5. Volume dynamics for glassware production, 2006-2010 forecast, in natural calculation
Figure 6. Regional segmentation of bottle production in the Russian federation, 10 months of 2010, in natural calculation
Figure 7. Dynamics of bottle production by region of the Russian federation, 2007-2010 forecast, in natural calculation
Figure 8. Structure of regional glass cans production in the Russian federation, 10 months of 2010, in natural calculation
Figure 9. Dynamics of cans production by region of the Russian federation, 2007-2010 forecast, in natural calculation
Figure 10. Revenue dynamics of glassware producing enterprises, 2006-2010, billion rub / year
Figure 11. Production capacity of the largest participants of the glassware market (total cans + bottles), in natural calculation, 2008 - forecast 2010.
Figure 12. Dynamics of glassware import in the Russian federation, 2007-2010
Figure 13. Glassware import structure and dynamics in the Russian federation by types of products, in natural calculation, 2007-2010
Figure 14. Import structure of glassware by types in dynamics for 2007-2010, in natural calculation
Figure 15. Dynamics of changes in average import prices for glassware, $ / 1000 pcs, 2007-2010
Figure 16. Shared distribution of countries in glassware deliveries in the Russian federation, 2009-2010, in natural calculation
Figure 17. Dynamics of glassware exports from the Russian federation, 2006-2010
Figure 18. Structure and dynamics of glassware export from the Russian federation by types of products, 2007-2010, in natural calculation
Figure 19. Shared distribution of glassware consuming countries, supplying glassware from the Russian federation, 9 months of 2010
Figure 20. Dynamics of export prices for glassware
Figure 21. Rating of the largest glassware exporting companies from Russia, 9 months of 2010
Figure 22. Volume of bottle consumption in the Russian federation, mln. Pcs / year
Figure 23. Cans consumption volume in the Russian federation, mln. Pcs / year
Figure 24. Forecast consumption of glassware in 2010
Figure 25. Dynamics of beer production in the Russian federation, 2005-2010, mln. Dkl.
Figure 26. Shareв distribution of rf regions in the production of beer, according to Rosstat, mln. Dkl, 1-3 quarter of 2009-2010
Figure 27. Dynamics of vodka and alcohol beverages production in the Russian federation, 2005-2010 forecast
Figure 28. Structure of vodka and alcohol beverages production by region, 2010
Figure 29. Dynamics and forecast of alcohol beverages production in the Russian federation, own expert assessment
File name: API-1258