
CONTENTS
TECHNICAL ENQUIRY
GENERAL PRODUCT DATA
ALUMINUM COMPOSITE PANELS MARKET VOLUME ESTIMATION
RUSSIAN MANUFACTURERS OF ACP
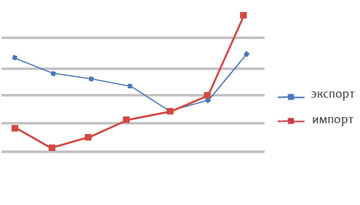
IMPORT AND EXPORT OF ACP
Import of aluminum composite panels in 2012-2016.
Import dynamics
Structure of imports by producers and brands
Import structure of aluminum composite panels by main recipients in 2012-2016
Import prices for aluminum composite panels in 2012-2016
Export of aluminum composite panels 2012-2016
Export dynamics of aluminum composite panels in 2012-2016
Export structure of aluminum composite panels by producers and brands in 2012-2016
Export prices for aluminum composite panels in 2012-2016
APPENDICES
Appendix 1. Import analysis method for ACP
LIST OF TABLES AND DIAGRAMS
Table 1. Estimation of the Russian market of aluminum composite panels, 2012-2016, million m2
Table 2. The list of the main Russian manufacturers of ACP in 2011-2016.
Table 3. Parameters of the activity of Russian ACP manufacturers, the dynamics of sales revenue, 2011-2016, million RUR.
Table 4. The volume aluminum composite panels imports in total, with detailed thickness, thousand m2 and thousand USD, 2012-2016.
Table 5. Import structure of aluminum composite panels by manufacturer, thousand m2 and million USD, 2012-2016.
Table 6 Import volume of aluminum composite panels by major producers and brands in 2012-2016, thousand m2 and thousand USD.
Table 7. Import volume of aluminum composite panels by country of origin in 2012-2016, thousand m2 and thousand USD.
Table 8. Import volume of aluminum composite panels by main recipients in 2012-2016, thousand m2 and thousand USD.
Table 9. Import volume of aluminum composite panels by main producers and recipients in 2012-2016, thousand m2 and thousand USD.
Table 10. Weighted average import prices for aluminum composite panels for major countries of origin in 2012-2016, USD per m2
Table 11 Weighted average import prices for aluminum composite panels by main producers and brands in 2012-2016, USD per m2
Table 12. Export volume of aluminum composite panels in total, detailed thicknesses in 2012-2016, m2 and thousand USD.
Table 13. Exports volume of aluminum composite panels by major producers and brands in 2012-2016, m2 and thousand USD.
Table 14 Weighted average export prices for aluminum composite panels by major producers in 2013-2016, USD per square meter.
Diagram 1. Dynamics and structure of the Russian market of aluminum composite panels in a cut on an origin of production,
Diagram 2. Capacity utilization for ACP production in Russia, 2017, million m2, %
Diagram 3. Forevast of Russian market of ACP, comparison with current production capacities
Diagram 4. The structure of the Russian production of ACP in the context of producers, 2017, million m2, %
Diagram 5. Dynamics of revenue from sales of the main Russian ACP manufacturers,
Diagram 6. Import dynamics of aluminum composite panels in total, with detailed thickness, thousand m2 and thousand USD, 2012-2016.
Diagram 7. Import volume of aluminum composite panels by major producers in 2012-2016,% (thousand m2 and million USD)
Diagram 8. Import volume of aluminum composite panels by country of origin in 2012-2016,% (thousand m2 and thousand USD)
Diagram 9 Export dynamics of aluminum composite panels in total, with detailed thickness in 2012-2016, m2 and thousand USD.
Diagram 10 Export volume of aluminum composite panels by major producers in 2012-2016,% (m2, thousand USD)
Diagram 11 Weighted average export prices for aluminum composite panels by main producers in 2015-2016, USD per square meter.
|
Task |
Result format |
|
To assess the dynamics and market size of transparent structures of aluminum and glass in general and in the context of enlarged segments |
Dynamics of the Russian market of transparent structures in 2013-2017, thousand m2
|
|
To assess the dynamics and volume of alucobond market |
Import dynamics of alucobond in Russia in 2013-2017 (prices, major manufacturers, product parameters) |
|
Identification of promising niches among different types of transparent constructions |
|
|
Preparation of the consolidated analytical report |
Preparation of a consolidated report on all sections, including recommendations for the promotion of transparent structures on the market |