
Terms of reference for the development of a strategy for the development of the pharmaceutics, biotechnology and biomedicine cluster of the Kaluga region
Preamble
I. Analysis of key drivers for the development of the global and Russian market of pharmaceutics, biomedicine and biotechnologies
1.1. Global development trends of priority directions of pharmaceutics, biomedicine and biotechnology
1.2 priority trends of development of the Russian market of pharmaceutics, biomedicine and biotechnology
1.2.1. The general situation in the Russian market
1.2.2. The volume of the pharmaceutical market of Russia in comparison with other countries of the world
1.2.3. Pharmaceutical drug manufacturers in the retail commercial market
1.2.4. FPP of the retail commercial market in the Russian federation
1.2.5. Vital drugs
1.2.6. Price segmentation of drugs in the retail commercial market
1.2.7 new drugs in the retail commercial market
1.2.8. Additional drug provision
1.2.9 sales volumes of the MPI segment
1.2.10 analysis of market events
1.2.11 forecast
1.2.12 generic market (according to IMS health data)
1.2.13 dietary supplements
1.2.14 cosmetics
1.2.15 import of FPP
1.2.16 pharmacy chains
1.2.17 distribution sector of the pharmaceutical market
1.2.18 production
1.2.19 the pharmaceutical market of Russia, I half of 2012
1.2.20. Events of the pharmaceutical market (I half of 2012)
1.3. Sector standards
1.3.1. Good manufacturing practice (GMP)
1.3.2. Preclinical trials (studies)
1.3.3. Market development factors
1.3.4. Production of pharmaceutical substances and accompanying technological and procedural engineering
1.3.5. Professional standards. Industrial pharmaceuticals
1.3.6. Clinical trials in Russia
1.4. State pharmaceutical policy
1.4.1. Legislative programs and acts aimed at supporting the development of the pharmaceutical industry in Russia
1.4.2. Federal development program for the pharmaceutical industry of the Russian federation for the period until 2020 (pharma 2020 program)
1.4.3. Analysis of the main development trends of the Russian pharmaceutical industry in the key criteria of "Pharma 2020"
1.4.4. State program "development of the pharmaceutical and medical industry" for 2013 – 2020
1.5. Basic development trends in the Russian nuclear medicine
1.5.1. The main areas of nuclear medicine
2. Analysis of the current level of development of the Kaluga pharmaceutical cluster and the general level of infrastructure and social ecosystem development in the Kaluga region
2.1. Scope of the cluster
2.2. Description of key cluster participants
2.3. Development of key competencies of cluster participants, as focuses for innovative development, based on the key global and Russian trends of the pharmaceutical market
2.4. “anchor” industrial pharmaceutical companies of the cluster
2.5. Leading small and medium cluster organizations
2.7. The role of small and medium companies of the Kaluga pharmaceutical cluster
2.8. Estimated forecast of production development (large, medium and small) of cluster enterprises by sectors of pharmaceutical products
2.9. Degree of geographical localization (near the territorial location) of the main manufactures. Opportunities and restrictions related to spatial localization of cluster participants
2.10. Overall assessment of cluster security with objects of transport, energy, communal, housing, educational and social infrastructures
2.11. Manufacture of radioisotopes, radio-pharmaceutical products and radiation sources for nuclear medicine
2.12. Potential of regional research and production personnel according to the requirements of key global and Russian market trends of pharmaceutics, biomedicine and biotechnologies
2.12.1. The main scientific and educational organizations participating in the cluster
2.12.2. Creation of a training center for pharmaceutical manufacturing
2.13. Development of key competencies of cluster participants, as focuses for innovative development, based on the key global and Russian trends of the pharmaceutical market
2.13.1. Priority areas for the development of pharmaceutical and biomedical technologies and medicines
2.13.2. Identification of markets and segments with the greatest opportunities for distribution of cluster products, including in the long term
2.13.3. Trends in market segments that are key for participants in the Kaluga pharmaceutical cluster
2.14. Development, synthesis and implementation of pharmaceutical substances - one of the key competences of participants of the Kaluga pharmaceutical cluster
2.14.1. The Russian market for the production of pharmaceutical substances and related technological and procedural engineering Russian manufacturers of pharmaceutical substances
2.14.2. Direct competitors in the field of synthesis of active pharmaceutical substances (aps) to enterprises of the Kaluga pharmaceutical cluster, and their level of competence
2.14.3. System infrastructure centers (centers for shared use) in the field of technological engineering in pharmaceuticals and biomedicine
2.14.4. GLP system preclinical research centers
2.15. Priority directions of cooperation of cluster participants in the field of research and development, based on key global and Russian trends of the pharmaceuticals market, biomedicine and biotechnologies
2.15.1. Development of production potential and production cooperation
2.15.2. Increasing the level of cooperation of cluster members through effective cluster management structures
2.16. Availability of target financial resources (institutions of development, industry ministries and departments, external industry strategic investors)
2.16.1. Factors characterizing the investment attractiveness of the cluster and its territory
2.16.2. Collaboration with development institutions
2.17. Cooperation with technological platform "biotech 2030"
2.18. Cooperation with “RVC”, JSC
2.19. Cooperation with "VEB" group
2.20. Participation in the federal program of the ministry of economic development of the Russian federation to support "pilot innovative clasters"
2.21. Evaluation of objectively existing criteria of efficiency (competence) of participants of the cluster and criteria of efficiency of the existing cluster ecosystem
2.21.1. Problems and bottlenecks in the development of the scientific, technological and educational potential of the cluster, which have a significant impact on the prospects for its development (swot analysis)
2.21.2. Problems and bottlenecks in the development of production potential, which have a significant impact on the prospects for cluster development
2.21.3. Analysis of the main risks of creating infrastructure centers for technological engineering in the field of biopharmaceuticals in the Kaluga region (swot analysis)
Strengths
Weaknesses
Environmental capabilities
Threats
2.21.4. Consolidated swot - cluster analysis
2.22. The need for cluster participants in “infrastructural” and service competencies, single for all (key) cluster participants, able to increase the cluster competitiveness, in general 4
2.22.1. Production of pharmaceutical substances and accompanying technological and procedural engineering
2.22.2. System infrastructure centers (centers for shared use) in the field of technological engineering in the field of pharmaceuticals and biomedicine
2.22.3. Federal program for the development of the pharmaceutical industry of the Russian federation for the period until 2020 (pharma 2020 program)
2.22.4. GLP system preclinical research centers
2.22.5. Technology transfer system centers
2.22.6. The main infrastructural centers created by the nonprofit partnership “Kaluga pharmaceutical cluster”
2.23. Effective use by large industrial enterprises. (by residents of the cluster and parties to the cluster by industrial pharmaceutical companies) infrastructure service centers created by innovative companies - participants of the cluster
3. “road map” of cluster development, with intermediate steps by key indicators of efficiency from 2012 to 2016 and prospects till 2020.
3.1. System recommendations for the effective use and development of advantages provided already by the participants of the cluster and the cluster ecosystem key competences.
3.1.1. Priority projects demanded by the majority of cluster members, increasing the competitiveness of residents of the cluster and the entire cluster as a whole
Project "pharmaceutical industry training center"
Projects for the development of industrial parks infrastructures of the Kaluga pharmaceutical cluster
Projects for the creation and development of an infrastructure logistics center (warehouse) of pharmaceuticals and raw materials and for the creation and development of a waste disposal center for industrial pharmaceutical enterprises
Project "waste management center"
Project "union of pharmaceutical and biomedical clusters of Russia"
3.1.2. Roadmaps and key criteria for the effectiveness of projects, the competence users of which will be mainly large industrial enterprises of the cluster (and medium-sized innovative companies, in some cases)
Projects related to the development, synthesis and introduction of pharmaceutical substances into production
Projects related to the development of infrastructure centers needed to create a complete chain for the development and implementation of original and innovative drugs
Projects aimed at developing network (international) cooperation with leading global centers (clusters) in the field of pharmaceuticals and biomedicine
Projects related to the development of cluster-critical competencies (currently lacking in the required quality) competencies - in the field of biomedicine and biotechnology
Selected events related to the development of cluster relations with institutional partners
Creation of the federal high-tech innovation center for medical radiology
4. Hierarchic structure of goals and an enlarged plan to achieve key indicators of the cluster development strategy
5. Summary of proposals for priority projects aggregated evaluation criteria of their core competencies and priority support actions for the implementation of the project by the np "Kaluga pharmaceutical cluster" and the administration of Kaluga region, based on an analysis of promising cluster projects (without large investment projects by industrial enterprises)
Appendices
Appendix 1. Consolidated road map of perspective projects development of Kaluga pharmaceutical cluster: 2012 - 2020.
Appendix 2. Basic directions for cluster development
Annex 3. Interview with participants of the cluster
Glushkov I. A., head of the corporate development department of the Moscow representative office of stada c.a.e., LLC
Yeremeyev Y.A., deputy minister of economic development of the Kaluga region
Shereykin M.I., vice prime minister of the government of the Kaluga region
Efimov I.V., mir-pharm company
Konov A.V., deputy director of the medical radiological center of the ministry of health of the Russian federation (Obninsk)
Roziev R.A., director of NPP Medbiofarm LLC
Puchnin V.S., general director of Obninsk chemical and pharmaceutical company LLC
Koshik A.P., new century project manager, Novo Nordisk a / s
Soloviev Y.M., international projects director, Niarmedik plus LLC
Appendix 4. Participants of TP "Biotech 2030"
Appendix 5. Russian pharmaceutical companies (according to the pharmexpert), which position themselves as the manufacturers of experimental and industrial volumes of API
Appendix 6. Meeting protocol of the state duma committee
On science and scientific technologies
Appendix 7. Goals and objectives of the created union of pharmaceutical and biomedical clusters of Russia (excerpt from the statute and the founding agreement)
LIST OF TABLES AND DIAGRAMS
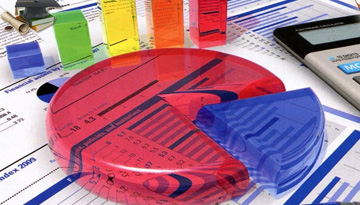
Figure 1. Distribution of the profit of pharmaceutical companies included in the top 50 in 2010
Figure 2. Geographical structure of the global pharmaceutical market in monetary expression in 2010 with indication of growth rates of sales volumes compared to the previous year
Figure 3. Top-20 products by volume of sales in the world (billion usd)
Figure 4. Top-20 therapeutic classes of drugs by volume of sales in 2010 in the world (billion usd)
Figure 5. Capacity of the pharmaceutical market of Russia, billion rub
Figure 6. Capacity of the pharmaceutical market of Russia, million usd
Figure 7. Volume of retail market of drugs in Russia and other countries in 2011
Figure 8. Consumption of FPP in Russia and other countries in 2011
Figure 9. Volume ratio of sales of import and domestic drugs
Figure 10. Volume ratio of sales of OTC and RX products of the retail commercial market of Russia.
Figure 11. Structure of the commercial drug market in 2010-2011
Figure 12. Weighted growth of FPP for the retail commercial market
Figure 13. Ratio of sales between ved and non-ved
Figure 14. Structure of value sales of FPP for retail commercial market by price segments.
Figure 15. Change of prices for FPP on the commercial market of Russia in 2011
Figure 16. Price index for drugs of import and domestic manufacturers in the commercial market of Russia in 2011
Figure 17. Dynamics of the number of federal beneficiaries (million persons) and volume of money expended by the program
Figure 18. Ratio of costs for the “7 icd codes” program and essential drug coverage program in the total amount of the expended funds for the drug coverage program, in rubles.
Figure 19. Sales ratio of import and domestic drugs
Figure 20. Sales ratio of import and domestic drugs in the program of “7 icd codes” and essential drug coverage
Figure 21. ATC group sales ratio in the supplementary drug program
Figure 22. Supplementary drug sales by price segments
Figure 23. Fact and forecast of supplementary drug sales at actual prices
Figure 24. Ratio of sales of imported and domestic FPP
Figure 25. Structure of the healthcare segment by price categories in 2011
Figure 26. Structure of the medicine segment by price categories for drugs of imported and domestic production in 2011
Figure 27. Hospital sales volume at actual prices (forecast)
Figure 28. Sales by ATC classes
Figure 29. Volumes of sales of dietary supplements in Russia in 2010-2011
Figure 30. Change in the prices for supplements on the commercial pharmacy market in Russia in 2011
Figure 31. Ratio of sales of domestic and imported dietary supplements produced by countries
Figure 32. Cosmetics sales volumes in Russia in 2010-2011
Figure 33. Ratio of pharmacy sales of cosmetics depending on the type of cosmetic product, 2011
Figure 34. Volume and growth of FPP import in 2011
Figure 35. Concentration of top-10 pharmacy chains
Figure 36. Concentration in the distribution segment
Figure 37. Russian commercial market of FPP in July 2011 - July 2012
Figure 38. Structure of different price categories on the commercial pharmacy market of FPP in Russia in July 2012
Figure 39. Ratio of sales of imported and domestic drugs on the commercial pharmacy market of Russia in July 2012,%
Figure 40. Ratio of sales volumes of recipe and FPP on the commercial pharmacy market of Russia in July 2012,%
Figure 41. Change in prices for FPP on the commercial pharmacy market of Russia
Figure 42. Commercial market of dietary supplements in Russia in July 2011 - July 2012
Figure 43. Change in the prices for dietary supplements on the commercial market of Russia in December 2011 - July 2012
Figure 44. Drug development process
Figure 45. Costs distribution in the development of drugs
Figure 46. Comparative cost of drug development in Russia and abroad (first-in-class drugs)
Figure 47. Comparative cost of drug development in Russia and abroad (next-in-drugs)
Figure 48. Stages in the development of innovative drugs: clinical trials and production
Figure 49. Worldwide clinical trials
Figure 50. Example of “clinstar” patient recruitment for blood disease research
Figure 51. Countries with the highest kearney index: country attractiveness for clinical trial
Figure 52. Determination parameters of country attraction index of clinical trial
Figure 53. Clinical trial cost index per patient
Figure 54. Shares of clinical trial in different phases
Figure 55. Terms of clinical trial in Russia and world
Figure 56. Market volume in monetary expression. Advance of the “pharma 2020” strategy forecast
Figure 57. Growth dynamics of the pharmaceutical market and the share of domestic preparations in monetary expression
Figure 58. Volume of sales of domestic preparations on the pharmaceutical market of the Russian federation in monetary expression
Figure 59. Domestic sales volume in physical terms
Figure 60. Average price reduction in the public sector
Figure 61. Retail sector growth rate
Figure 62. Increase in monetary share of domestic medicines
Figure 63. Russian production growth rate in monetary terms
Figure 64. Structure of the pharmaceutical market in monetary terms in 2011
Figure 65. Ved analysis 2011
Figure 66. Strategic drugs (sm)
Figure 67. Prospects and cost of "import substitution", 2011
Figure 68. Financing structure of Russian pharmaceutical market in 2011
Figure 69. Analysis of 246 inn from supplementary drug and hospital purchases (up to 90% monetary terms)
Figure 70. Change in the structure of the public procurement market compared to 2009 in monetary terms
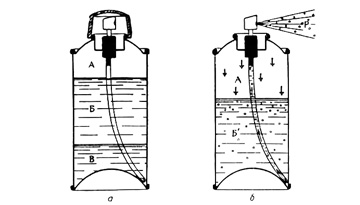
Figure 71. Examples of using different radionuclides in “in vivo” diagnostics
Figure 72. Principle of obtaining the image of the radionuclide distribution during “in vivo” diagnostics
Figure 73. Principle of positron emission tomography
Figure 74. Special accelerator ss-18 for producing positronic radionuclides
Figure 75. Cyclotron ss-12 for 12 mev proton energy for clinical pet centers
Figure 76. Gas and liquid targets for carbon-1 production of fluorine-18 and nitrogen-13
Figure 77. Units of automated radio chemistry for radiopharmaceuticals synthesis
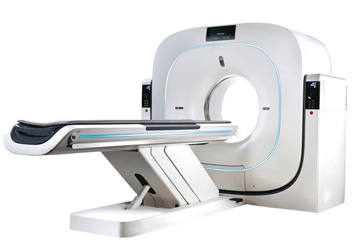
Figure 78. Full scale prototype of a full pet scanner
Figure 79. Speed of construction of hadron therapy centers
Figure 80. Number of patients per year by country and continent
Figure 81. An experimental model of a domestic one-photon emission computer tomograph
Figure 82. Isochronic cyclotron by RRC "Kurchatov institute"
Figure 83. Station of comprehensive research on medical diagnostics "Mediana"
Figure 84. Relationship of cluster members in the framework of development and production
Figure 85. Structure of the pharmaceutical market of the Russian federation of 2011 in monetary terms compared to 2010
Figure 87. "Hemofarm" LLC (stada cis), Obninsk
Figure 88. Project novo Nordisk - innovative production of insulins at the site of the Kaluga pharmaceutical cluster
Figure 89. Sales forecast for the cluster's products (on the materials submitted by the cluster manual)
Figure 90. Forecast of export of the cluster's products (on the materials submitted by the cluster manual)
Figure 91. Forecast of high quality jobs growth (as submitted by the cluster manual)
Figure 92. Industrial parks of the Kaluga region
Figure 93. Competitiveness of anchor cluster members - place on the world and Russian markets
Figure 94. Planned structure of the creating scientific and educational center of the cluster on the basis of Lomonosov state university
Figure 95. Network partnership of participants of the Kaluga pharmaceutical cluster
Figure 96. Most active directions for medicinal development
Figure 97. Prioritization matrix for therapeutic areas developed by McKinsey & company for the Russian pharmaceutical market (2011)
Figure 98. Nuclear medicine is one of the priority areas for the development of modern biomedicine
Figure 99. Ratio of OTC sales and RX drugs
Figure 100. Concentration in the distribution segment
Figure 101. Production and consumption of API in the Russian federation
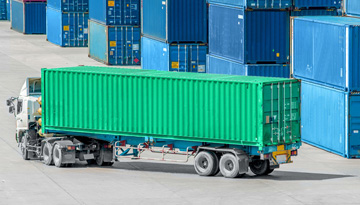
Figure 102. Export value of API in some countries of the world in monetary expression (us $ per 6.1 m container)
Figure 103. Cluster management structure
Figure 104. Summary business model of cooperative relationships of cluster members
Figure 105. Existing system problems of domestic pharmaceutics in the process of development and implementation of professional standards in the field of industrial pharmaceutics
Figure 106. Analysis of existing analogues of "professional standards" (qualification requirements) in pharmaceuticals with real needs in specific professions in the sphere of the industry
Figure 107. Professional competences of cluster members as a basis for development and implementation of professional standards
Figure 108. Proposed structure of the created branch of MSU on the basis of the Kaluga pharmaceutical cluster
Figure 109. Drug incubator project concept
Figure 110. Synergy of educational projects of the Kaluga pharmaceutical cluster
Figure 111. Distribution of federal subsidies to support "pilot" innovative-territorial clusters
Figure 112. Industrial parks - a key element of competitiveness of the industrial sphere of the Kaluga pharmaceutical cluster
Figure 113. Traditional warehouse with narrow aisle technology
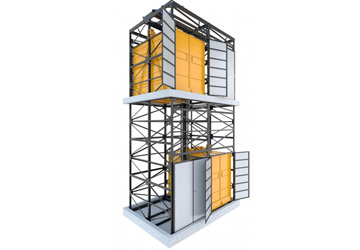
Figure 114. High warehouse
Figure 115. Concept of logistics center - pharmaceutical products warehouse for Kaluga pharmaceutical cluster
Figure 116. “Rostekhnologi – Biotechprom” JSC project to create a logistic hub and waste processing
Figure 117. Expectations of the Kaluga pharmaceutical cluster from entry and participation in the union of pharmaceutical clusters of Russia
Table 1. Rating of global pharmaceutical companies
Table 2. Structure of FPP sales in the retail commercial market of Russia by ATC group
Table 3. Top-20 drug manufacturing companies by pharmacy sales volume in Russian retail commercial market by the results of 2011
Table 4. Top-20 brands by sales volume in monetary terms on the commercial market of Russia in 2010-2011
Table 5. Top-20 new trade names of 2011 on the commercial market of the Russian federation
Table 6. Structure of FPP sales by ATC groups on supplementary drug market
Table 7. Supplementary drug cost rating by diseases, 2011
Table 8. Top-20 drug manufacturers by supplementary drug consumption in 2011
Table 9. Top-20 drug manufacturers by sales in supplementary drug segment in accordance with the "ICD code" program and essential drug reimbursement sub-program
Table 10. Top-20 brands by value sales in supplementary drugs segment in 2011
Table 11. Forecast supplementary drug segment (2010-2015)
Table 12. Structure of hospital procurement of FPP by ATC-groups
Table 13. Top-20 producers in the segment of health facilities
Table 14. Top-20 brands in the segment of health facilities
Table 15. Hospital segment forecast
Table 16. Events affecting the market (2011-2015)
Table 17. Preliminary data for retail segment (2010-2015)
Table 18. Preliminary data for supplementary drug sector (2010-2015)
Table 19. Preliminary data for the inpatient health services sector
Table 20. Key macroeconomic indicators
Table 21. Forecast for the ten leading therapeutic classes by ATC classification 1
Table 22 share in percentage terms of out-patient and inpatient sector by the licensing status
Table 23 share in percentage terms of out-patient and inpatient sector by the licensing clauses. Standard units
Table 24 share in percentage terms of out-patient and inpatient sector by the licensing status
Table 25 share in percentage terms in the scope of out-patient and inpatient sector by the licensing status
Table 26 distribution of medicine remedies' categories depending on market segmentation
Table 27 top-20 of dietary supplement producing companies in Russia in 2011.
Table 28 top-20 of dietary supplement brands sales in Russia in 2011.
Table 29 ranking of sales on dietary supplement classification code sections in 2011.
Table 30 a share of various groups of FPP import merchants to Russia in scope of FPP import in 2010 and 2011.
Table 31 top-10 of foreign manufacturers' agencies by volume of import in 2011.
Table 32.top-10 of distributors by volume of FPP import to Russia in 2010 and 2011
Table 33 top-20 of producing companies by volume of FPP import
Table 34 sales ranking of networks in 2011 at the pharma retail market
Table 35 top-10 of distributors at the FPP pharmaceutical market
Table 36 top-20 of producing companies by volume of sales at the pharmaceutical market in Russia in 2011
Table 37 share ratio of ATC groups of x-level in scope of FPP pharmacy sales in Russia in June-July, 2012, %
Table 38 top-10 of FPP producing companies by share in pharmacy sales in Russia (in value terms) in June-July, 2012
Table 39 top-10 of dietary supplement producing companies by volume of pharmacy sales (in value terms) in Russia in June July, 2012
Table 40 top-20 of dietary supplement tradenames by volume of pharmacy sales (in value terms) in Russia in June-July, 2012
Table 41 comparative characteristics of standard documentation by GMP in the countries of the European union, USA and Russia.
Table 42 distribution of R&D products over therapeutic areas
Table 43 comparative characteristic of cost of some types of nonclinical studies in USA, China and Russia
Table 44 main target indicators and figures of the program
Table 45 key indicators of the federal target program (ftp)
Table 46 ftp target indicators
Table 47 list of undergraduate degree programs on a pharmacy specialty (order of ministry of education and science no.4 dated January 12, 2005)
Table 48 most promising candidates to pharmaceutical products before 2013
Table 49 ratio of nuclear medicine investigative procedures by clinical specialties in USA and Russia
Table 50 some therapeutic radionuclides
Table 51 generators of α-emitters suitable for radioimmunotherapy
Table 52 nuclear and physical characteristics of ac and main daughter products of its natural radioactive decay
Table 53 rate of hadronic therapy centers construction
Table 54 main plants on radionuclides production in the world
Table 55 Russian manufacturers of enriched stable nuclides
Table 56 some cyclotron radionuclides and their medical application
Table 57 cyclotrons brought into operation in the territory of Russia
Table 58 radionuclide generators for medical use
Table 59 evaluation of Russian health care service needs in some radiopharmaceuticals
Table 60 prognosis for ten predominant therapeutic classes by ATC classification
Table 61 compliance of pharmaceutical products portfolio of cluster company with a sales market trend by predominant therapeutic categories
Table 62 total volume of sales in compliance with actual prices (2010 to 2015), MLN. Rub (by materials presented by cluster executive staff)
Table 63 pharmaceutical product manufactured (and planned for manufacture) by cluster residents (based on data presented by cluster residents)
Table 64 radiopharmaceuticals manufactured by Leipunsky institute of physics and power engineering in cooperation with FSBI NMRCC of the ministry of health of the Russian federation
Table 65 general criteria
Table 66. Highlight figures
Table 67 figures by years
Table 68 average results of use (unified national exam) by 100 - point scale (in Kaluga city)
Table 69 results of schoolchildren participation in the final step of academic competitions
Table 70 cluster-wide cooperation of cluster participants in science and education,
Table 71 current market coverage by segments (2011)
Table 72 total volume of sales in compliance with actual prices
Table 73 prognosis for distributive trade (2010 to 2015)
Table 74 prognosis for edc (extensive drug coverage) (2010 to 2015) segment
Table 75 prognosis for hospital segment (2010 to 2015)
Table 76 analysis of events
Table 77 top-10 of distributors at the FPP pharmaceutical market
Table 78 structure of FPP sales by ATC groups at the retail market
Table 79 share ratio of ATC groups of x-level in scope of FPP pharmacy sales in Russia in June-July, 2012, %
Table 80 prognosis for ten predominant therapeutic classes by ATC-1 classification based on the total volume of medicine remedies selling in out-patient and inpatient sectors in manufacturer's prices
Table 81 distribution of products of medicine remedy manufacturers - cluster participants over groups of consumers and distributors
Table 82 influence of analyzed pharmaceutical market key trends on development of predominant participants of Kaluga pharmaceutical cluster
Table 83 position of the predominant participants of Kaluga pharmaceutical cluster in high-priority therapeutic areas
Table 84 influence of system factors on development of the predominant participants of Kaluga pharmaceutical cluster ("+" - positive influence, "0" - neutral, "-" - negative)
Table 85 skill level of direct competitors of the predominant participants of Kaluga pharmaceutical cluster (on a 5 grade scale)
Table 86 key skills of the cluster participants
Table 87 cluster-wide matrix cooperation of cluster participants in the production and service infrastructures area
Table 88 cooperation of cluster participants with Russian enterprises and organizations not incorporated in the cluster (by data presented by the participants)
Table 89 matrix system of skills cooperation brought in by innovative cluster participants in research studies and developments as a base of the cooperation business model
Table 90 planned use of federal subvention resources by Kaluga pharmaceutical cluster
Table 91. Projects for implementation within the framework of the "development of the pharmaceutical and medical industry of the Russian federation for the period up to 2020 and further perspective" (ministry of the Russian federation and the industry)
Table 92. Correspondence of key competences of cluster members to priority drivers for the development of the pharmaceutical and biomedicine market
Table 93. Forecasted need of cluster members in a preclinical research center
Table 94. Participation of cluster residents in planned and existing infrastructure service centers
Table 95. Pharmaceutical stations produced in the "center for development and synthesis of pharmsubstances LLC "mir-pharm"
Table 96. Proposed matrix of professional competencies formed by participants of the Kaluga pharmaceutical cluster
Table 97. Presupplementary drugging of the Kaluga pharmacy cluster on the introduction of professional and educational standards
Table 98. Plan-schedule of the project "training center for the pharmaceutical industry"
Table 99. Summary data on the need for qualified personnel of pharmaceutical production plants of the Kaluga pharmaceutical cluster
Table 100. Distribution of federal subsidy funds for infrastructure projects of the Kaluga pharmaceutical cluster
Table 101. Modern concepts of warehouses. Summary table of economic indicators (input data - warehouse per 100,000 pallets), combined storage (standard conditions + cold zone)
Table 102. Ratio of declining capital costs for warehouses of different capacities
Table 103. Estimated calculation of the perspective demand of services for disposal of pharmaceutical products waste of the industrial enterprises of the Kaluga cluster
Table 104. Estimated calculation of cash turnover for the services of the unified system center for logistics and disposal of pharmaceutical products "pharmaceutical products" by the industrial enterprises of pharmaceuticals
Table 105. Project "union of pharmaceutical and biomedical clusters of Russia"
Table 106. Educational projects of the cluster
Table 107. Roadmap - projects of the cluster for the development of infrastructures of industrial parks
Table 108. Roadmap - project "Pharmaport" (initiator - JSC "Rostekhnolog2 - Biotechprom")
Table 109. Roadmap - scale investment projects of the largest cluster members (industrial pharmaceutical companies)
Table 110. Presupplementary drugs on criteria for project prioritization
Table 111. Proposals for the prioritization of promising cluster projects, the users of the competencies of which will mostly be large industrial enterprises of the cluster (and in some cases medium-sized innovative companies)
Table 112. Summary table of prioritization of perspective cluster projects, the users of the competences of which will be in a greater extent of large industrial enterprises of the cluster
Table 113. Project "infrastructure center" park of active molecules" (group of companies "Medbiopharm")
Table 114. Risks of the project "infrastructure center" park of active molecules" (group of companies "Medbiopharm")
Table 115. Proposed roadmap for implementation of the project "infrastructure center" park of active molecules" (group of companies "Medbiopharm" )
Table 116. Project "infrastructure center" development, synthesis and implementation of pharmaceutical substances "(LLC "mir-pharm", JSC "OKFHK", stada cis (LLC "Chemofarm")
Table 117. Medicinal products (pharmaceutical substances and prepared medicinal forms produced by LLC "mir-pharm")
Table 118. Risks of the “infrastructure center project development, synthesis and implementation of pharmaceutical substances "(“mir-pharm” LLC, “OKFHK" JSC, stada cis (“chemofarm” LLC)
Table 119. Proposed roadmap of the project implementation “infrastructure center "development, synthesis and implementation of pharmaceutical substances" (LLC "mir-pharm", JSC OKFHK", LLC
Table 120. Project "construction of a center for pre-clinical research of drugs with experimental production in "medical radiological scientific center of the ministry of health care and social relationship"
Table 121. Forecasted need for cluster members in a preclinical research center
Table 122. Roadmap for implementation of the project "creation of the center for pre-clinical research on GLP standards on the basis of national medical research radiological center of the ministry of health of the Russian federation
Table 123. Roadmap for the implementation of projects for development of the international cluster cooperation
Table 124. Prospective projects of the investment portfolio of “Niarmedic plus” LLC
Table 125. Roadmap for implementation of projects of “Niarmedic plus” LLC (with the involvement of cluster resources)
Table 126. Roadmap for the implementation of activities for developing the cluster ecosystem and effective communications with institutional partners
Table 127. A larger plan to achieve the strategic goals of the development strategy of the Kaluga pharmaceutical cluster
Table 128. Summary suggestions for priority of projects (excluding large investment projects of industrial enterprises)
File name: API-1523